Fig. 9
Download original image
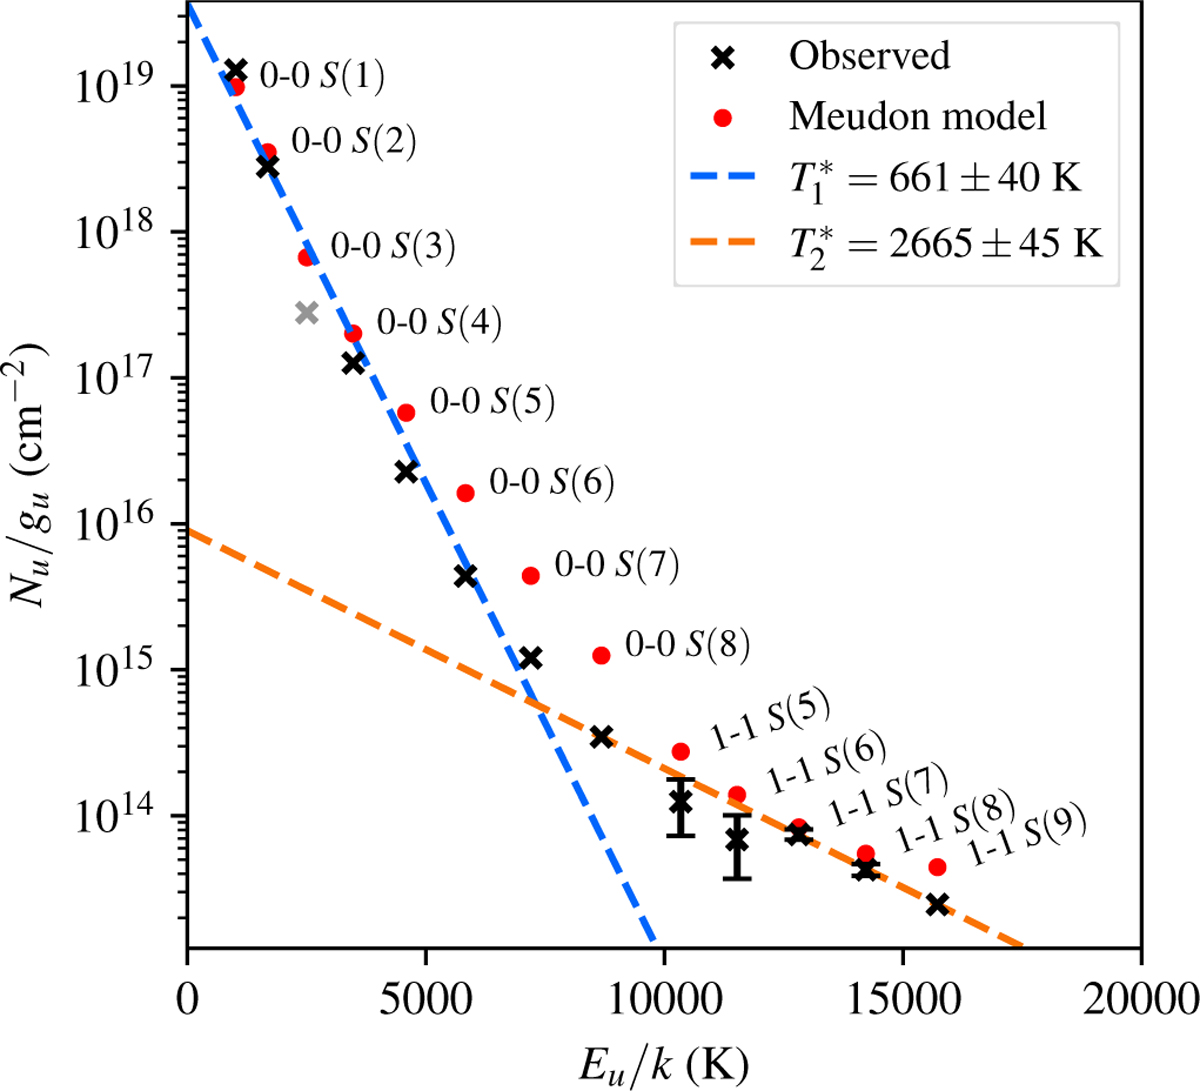
H2 excitation diagram for DF3, with linear fits and comparison to Meudon model. Black crosses: column density of the upper level populations derived from the data, versus the energy of the upper level with respect to the ground state. Error bars are shown where they exceed 5% (includes 3% systematic uncertainty). Red circles: column densities derived from our Meudon PDR model. Blue line: fit including lines up to 0–0 S (7), excluding the 0–0 S (3) line (gray) as it is subject to extinction by the 10 µm silicate feature. Orange line: fit including 0–0 S (8) and 1–1 S (5) to 1–1 S (9). Temperatures derived from the slope of each line are shown in the legend.
Current usage metrics show cumulative count of Article Views (full-text article views including HTML views, PDF and ePub downloads, according to the available data) and Abstracts Views on Vision4Press platform.
Data correspond to usage on the plateform after 2015. The current usage metrics is available 48-96 hours after online publication and is updated daily on week days.
Initial download of the metrics may take a while.