Fig. 10.
Download original image
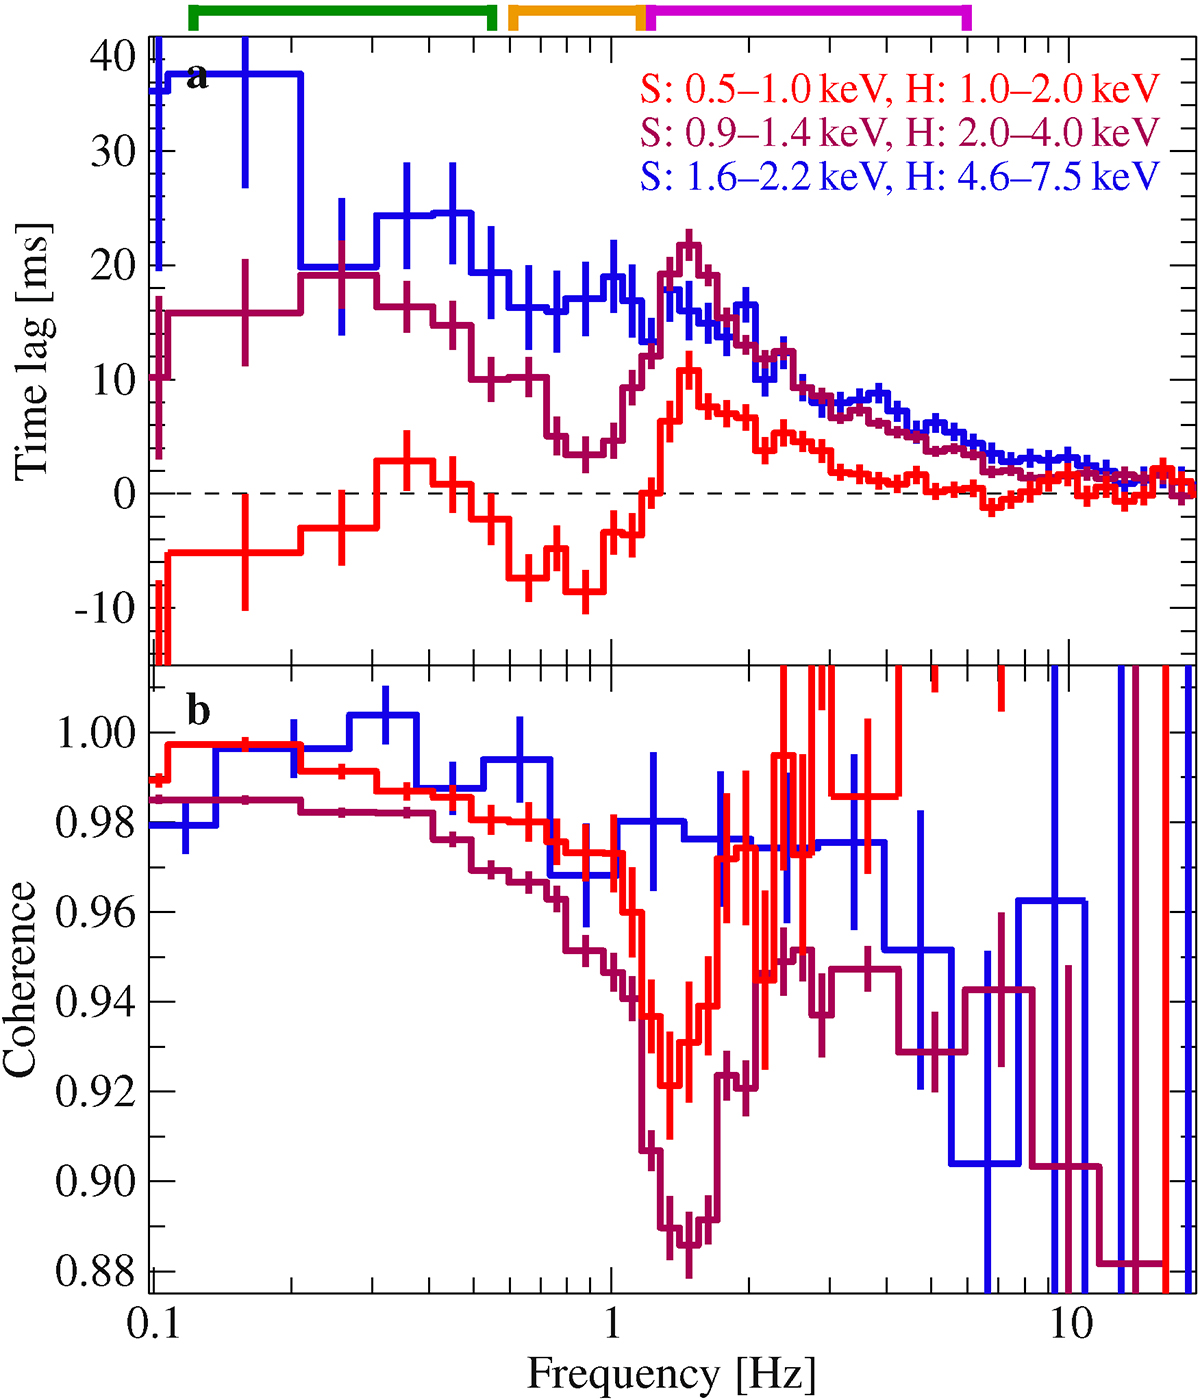
Lag-frequency and coherence spectra of observation 2636010101 of Cyg X-1 in the hard state for various energy bands. (a) Time lags between energy bands ≳1.5 keV show the well-known power law-like behavior (blue line), while an abrupt change in time lag with soft X-ray data ≲1.5 keV is seen (red and purple lines). (b) The coherence between high energy bands, when power law-like hard lags are seen, is close to unity. When the energy range is extended to below 1.5 keV, the coherence drops significantly between 1–2 Hz. Colored brackets on top denote the frequency ranges chosen for the lag-energy spectrum in Fig. 11.
Current usage metrics show cumulative count of Article Views (full-text article views including HTML views, PDF and ePub downloads, according to the available data) and Abstracts Views on Vision4Press platform.
Data correspond to usage on the plateform after 2015. The current usage metrics is available 48-96 hours after online publication and is updated daily on week days.
Initial download of the metrics may take a while.