Fig. 11.
Download original image
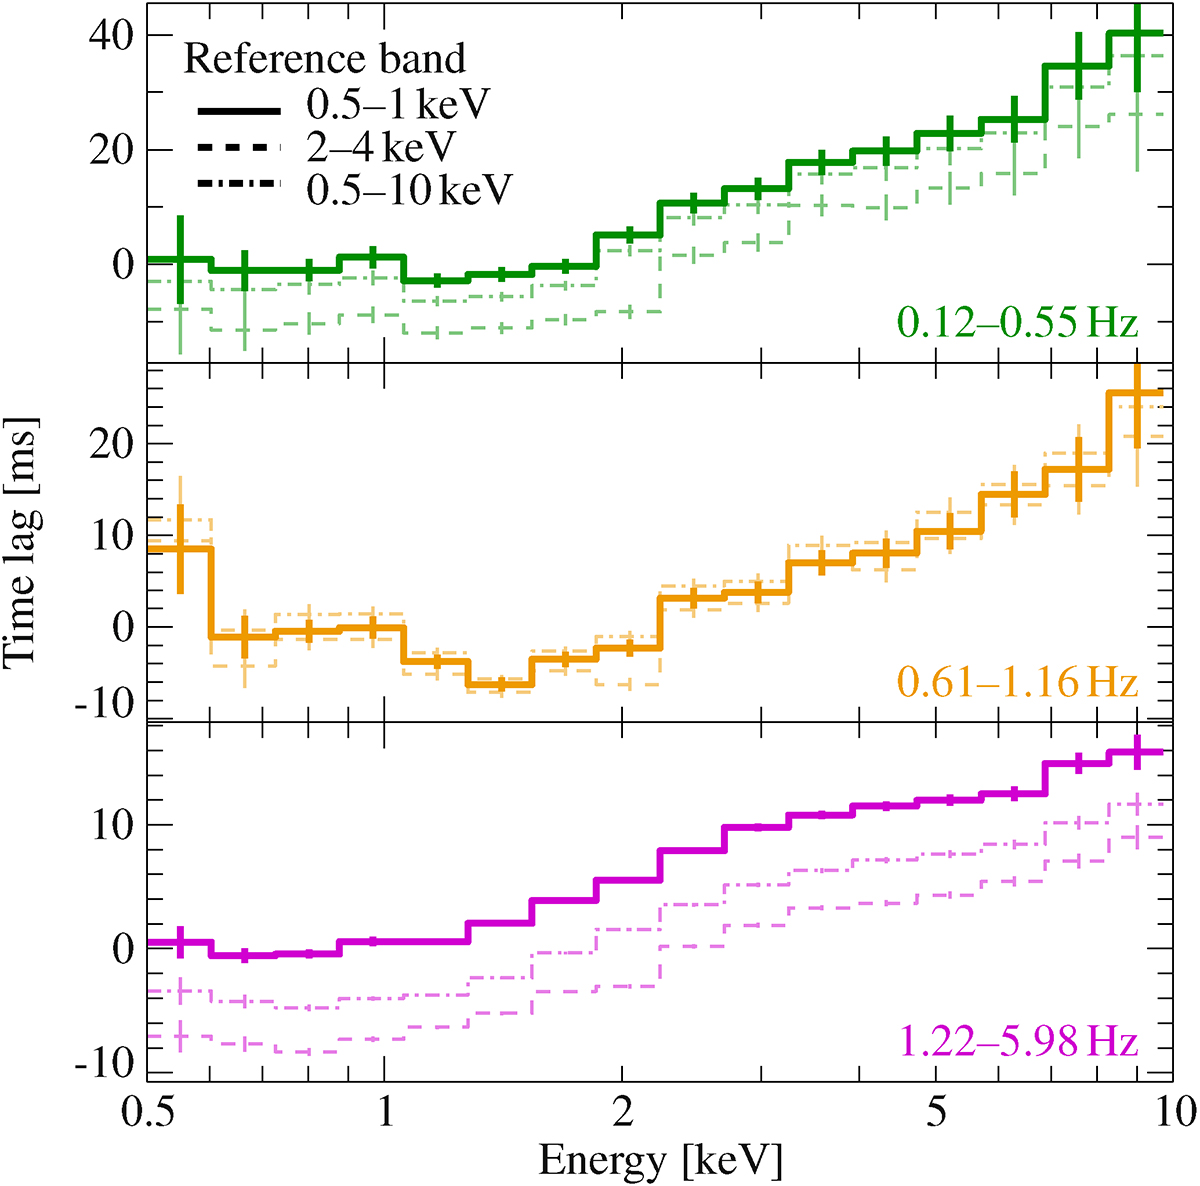
Lag-energy spectra of observation 2636010101 of Cyg X-1 in the hard state. Frequency ranges are chosen to trace the timing feature (colored brackets in Fig. 10). The low-frequency range, 0.1–0.6 Hz, shows hard lags. The frequency range 0.6–1.2 Hz during the dip in the lag-frequency spectrum shows an upturn at low energies (soft lags). This upturn vanishes at higher frequencies, 1.2–6 Hz, which covers the peak of the timing feature. Solid, dashed, and dash-dotted lines denote spectra for a broad, and two narrow reference bands.
Current usage metrics show cumulative count of Article Views (full-text article views including HTML views, PDF and ePub downloads, according to the available data) and Abstracts Views on Vision4Press platform.
Data correspond to usage on the plateform after 2015. The current usage metrics is available 48-96 hours after online publication and is updated daily on week days.
Initial download of the metrics may take a while.