Fig. 12.
Download original image
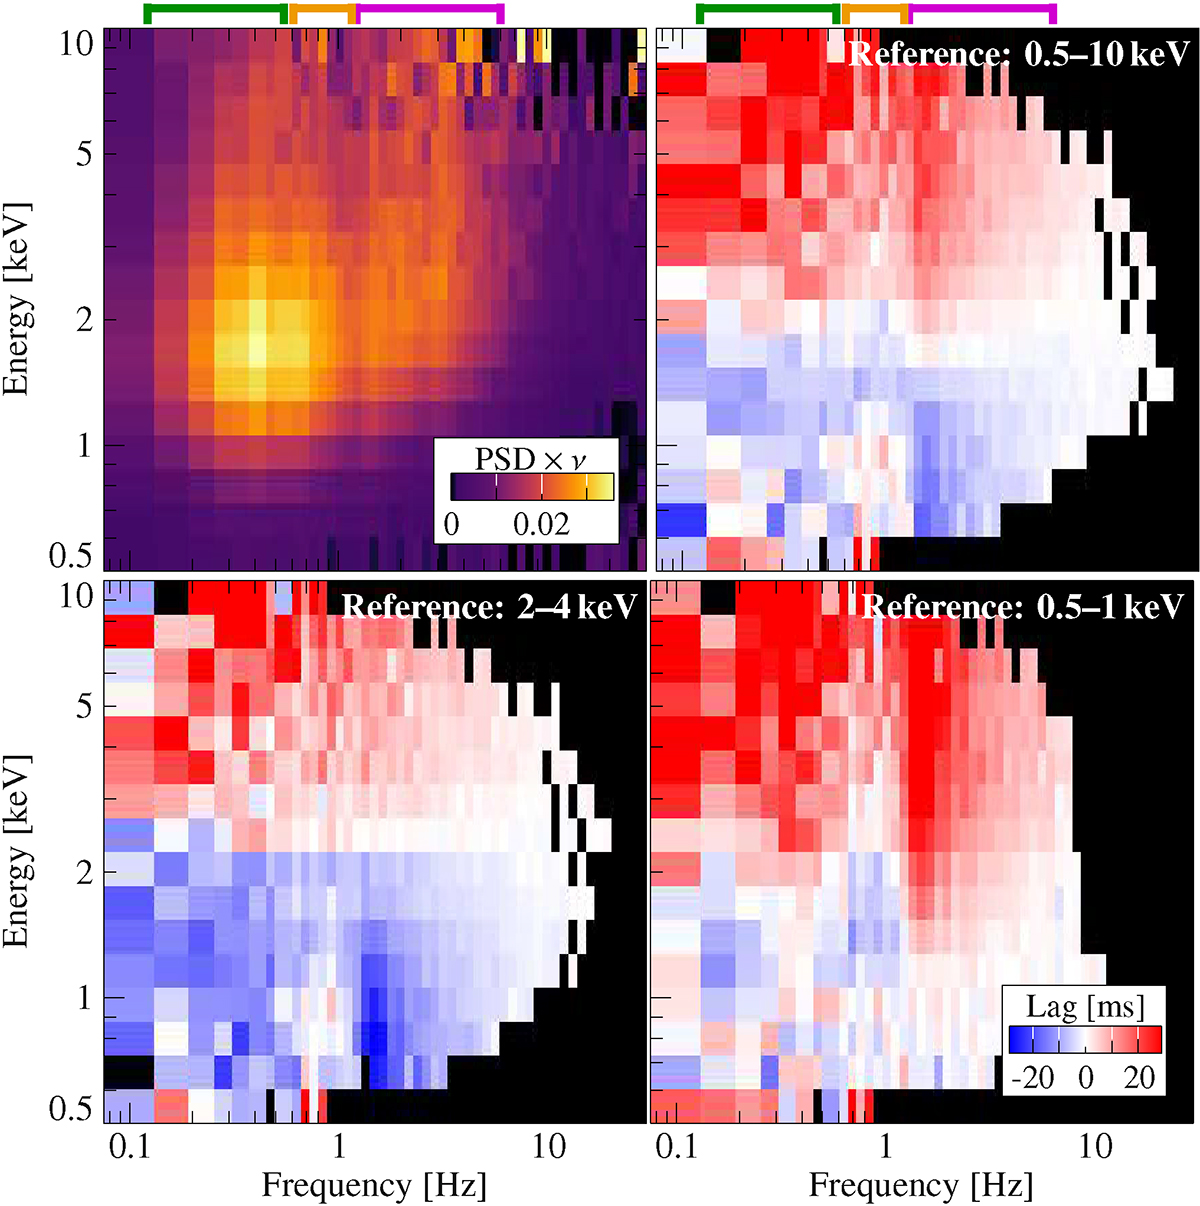
Energy-resolved time lag maps of observation 2636010101 of Cyg X-1 in the hard state. The maps are calculated between small energy bins and three reference bands, written in the top right corner of each plot. For reference, we also show the power map in the top left panel. Pixels where the coherence has an uncertainty larger than 50% of its value are set to black. Colored brackets on top denote the frequency ranges chosen for the lag-energy spectrum in Fig. 11.
Current usage metrics show cumulative count of Article Views (full-text article views including HTML views, PDF and ePub downloads, according to the available data) and Abstracts Views on Vision4Press platform.
Data correspond to usage on the plateform after 2015. The current usage metrics is available 48-96 hours after online publication and is updated daily on week days.
Initial download of the metrics may take a while.