Fig. 16.
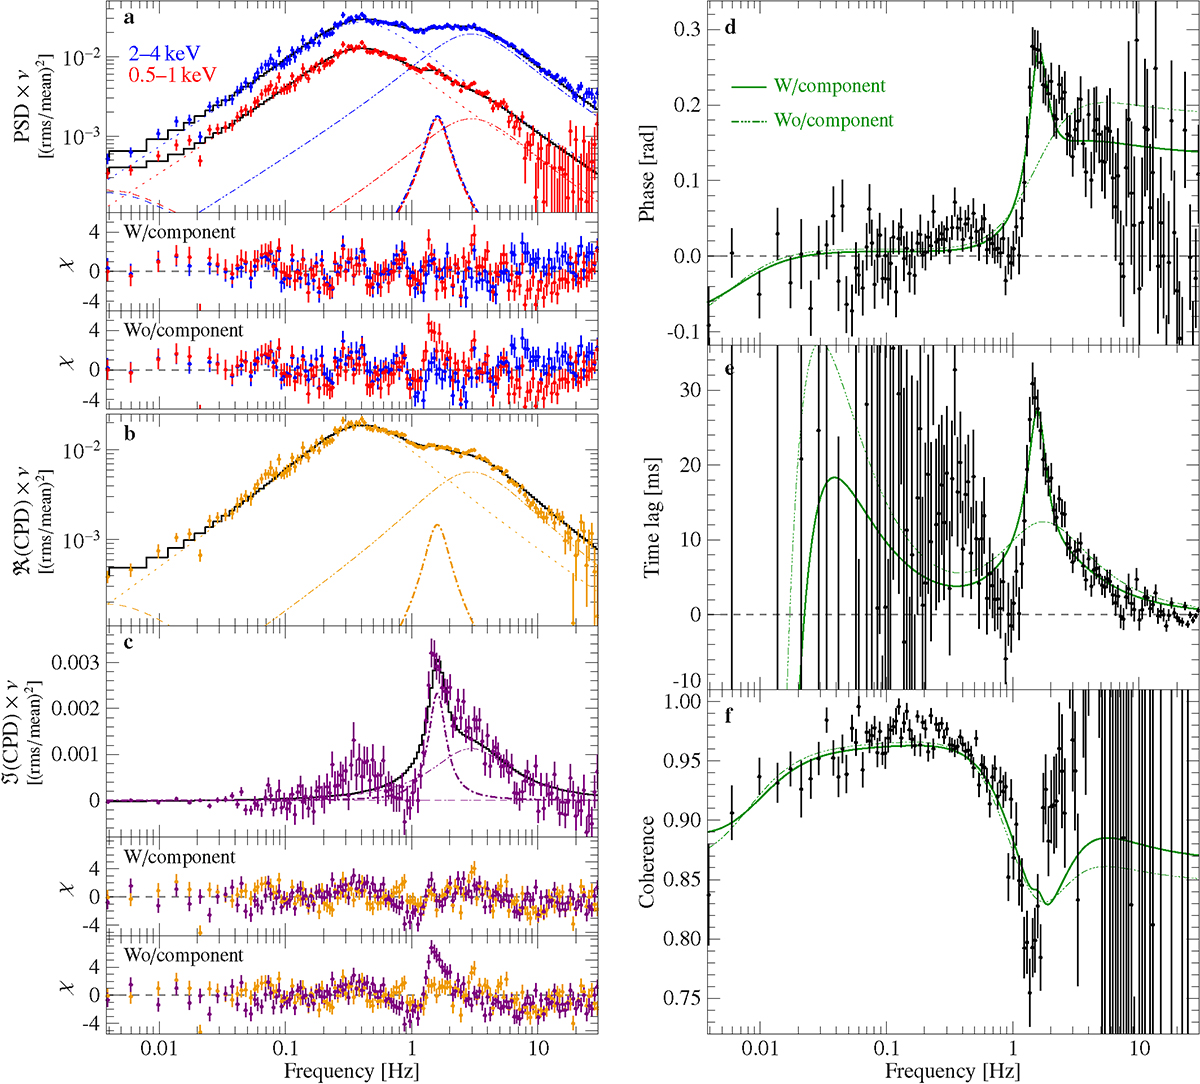
Download original image
Simultaneous fit of the power and cross spectra of Cyg X-1 for NICER observation 2636010101. The data can be modeled with one zero-centered Lorentzian (dashed line), two broad Lorentzians (dotted and dash-dot-dotted lines), and one narrow Lorentzian at 1.57 Hz (dash-dotted lines). The total fit model is shown as a black line. The fit model with and without the narrow component evaluated on the lags and coherence is shown as a solid and dash-dotted green line, respectively. (a) Power spectral density and fit residuals with and without the narrow component at 1.6 Hz. (b)–(c) Real and imaginary part of the cross spectrum (soft band: 0.5–1 keV, hard band: 2–4 keV) and the fit residuals with and without the narrow component. The additional Lorentzian is very significant in the imaginary part. (d)–(e) Model evaluated (not fitted) on the phase and time lag spectra. The model without the narrow component is shown as green dash-dotted line. (f) The coherence spectrum changes only slightly when including the narrow component. The dip at the overlap of L1 and L2 emerges because the Lorentzians are assumed to be incoherent with respect to each other.
Current usage metrics show cumulative count of Article Views (full-text article views including HTML views, PDF and ePub downloads, according to the available data) and Abstracts Views on Vision4Press platform.
Data correspond to usage on the plateform after 2015. The current usage metrics is available 48-96 hours after online publication and is updated daily on week days.
Initial download of the metrics may take a while.