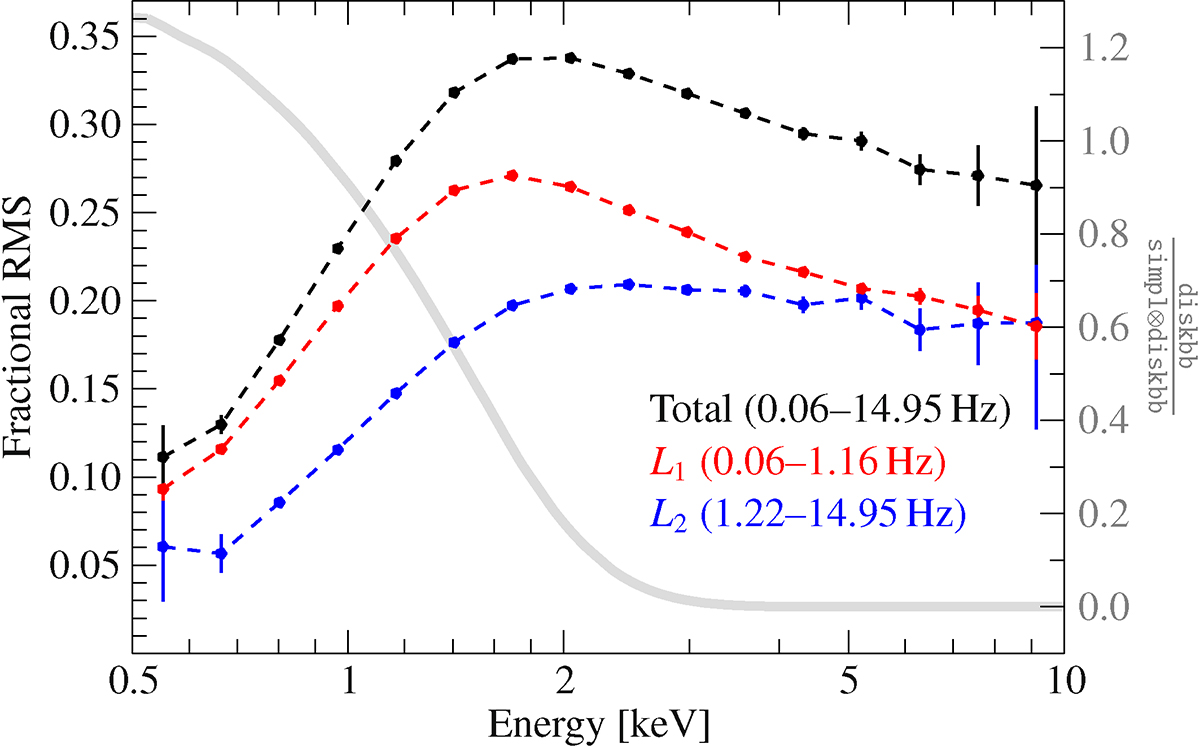
Fig. A.1.
Download original image
RMS spectrum of observation 2636010101 of Cyg X-1 at Γ ∼ 1.8. The black dashed line shows the total RMS averaged over the 0.06–15 Hz range, which peaks at around 2 keV. The low- (red) and high-frequency (blue dashed line) variability shows a bimodal behavior. The high-frequency variability from L2 remains constant above ∼2 keV, while the RMS of L1 drops off. Below roughly 1.5 keV, the variability drops at all frequencies. The remaining variability is dominated by L1. The gray curve with the scale on the right axis measures the contribution from the accretion disk in the hard state. L1 peaks at ∼1.7 keV where the disk contributes ∼40% of the flux.
Current usage metrics show cumulative count of Article Views (full-text article views including HTML views, PDF and ePub downloads, according to the available data) and Abstracts Views on Vision4Press platform.
Data correspond to usage on the plateform after 2015. The current usage metrics is available 48-96 hours after online publication and is updated daily on week days.
Initial download of the metrics may take a while.