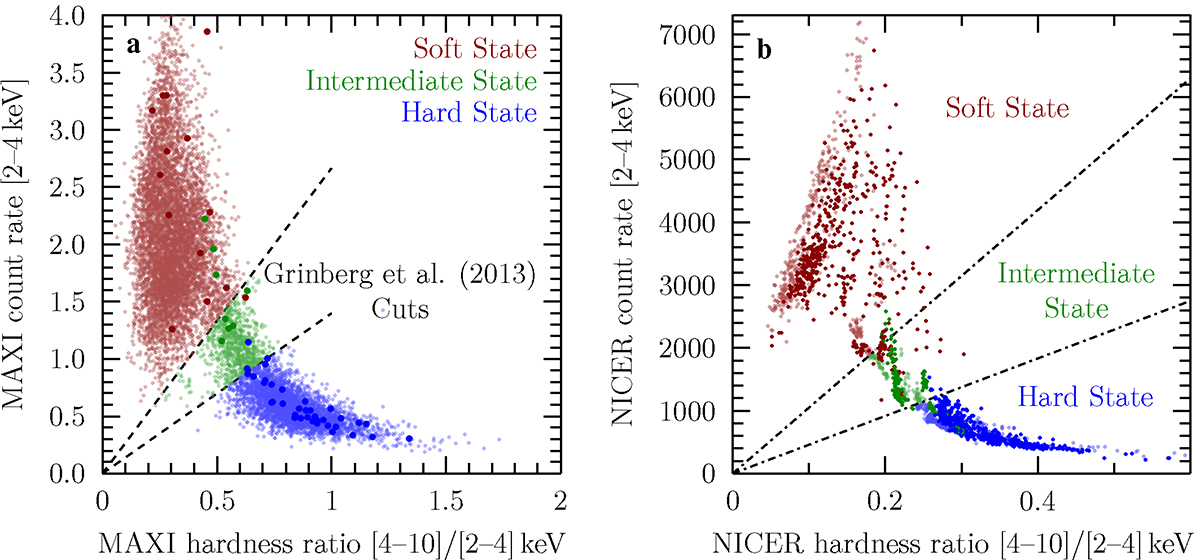
Fig. 2.
Download original image
Hardness-intensity diagrams of Cyg X-1. (a) HID using MAXI count rates from 6 h binned light curves. Light points are classified according to Grinberg et al. (2013, dashed line). Solid points denote MAXI time bins which have a NICER bin falling into the 6 h time frame, colored according to our NICER cuts. (b) HID using NICER count rates from 100 s binned light curves. Light points are colored according to our NICER criterion. Solid points denote NICER time bins which fall into the 6 h MAXI time frame and are classified according to the MAXI cuts. The NICER cuts (dash-dotted line) are chosen such that the MAXI criterion is reproduced with minimal contamination.
Current usage metrics show cumulative count of Article Views (full-text article views including HTML views, PDF and ePub downloads, according to the available data) and Abstracts Views on Vision4Press platform.
Data correspond to usage on the plateform after 2015. The current usage metrics is available 48-96 hours after online publication and is updated daily on week days.
Initial download of the metrics may take a while.