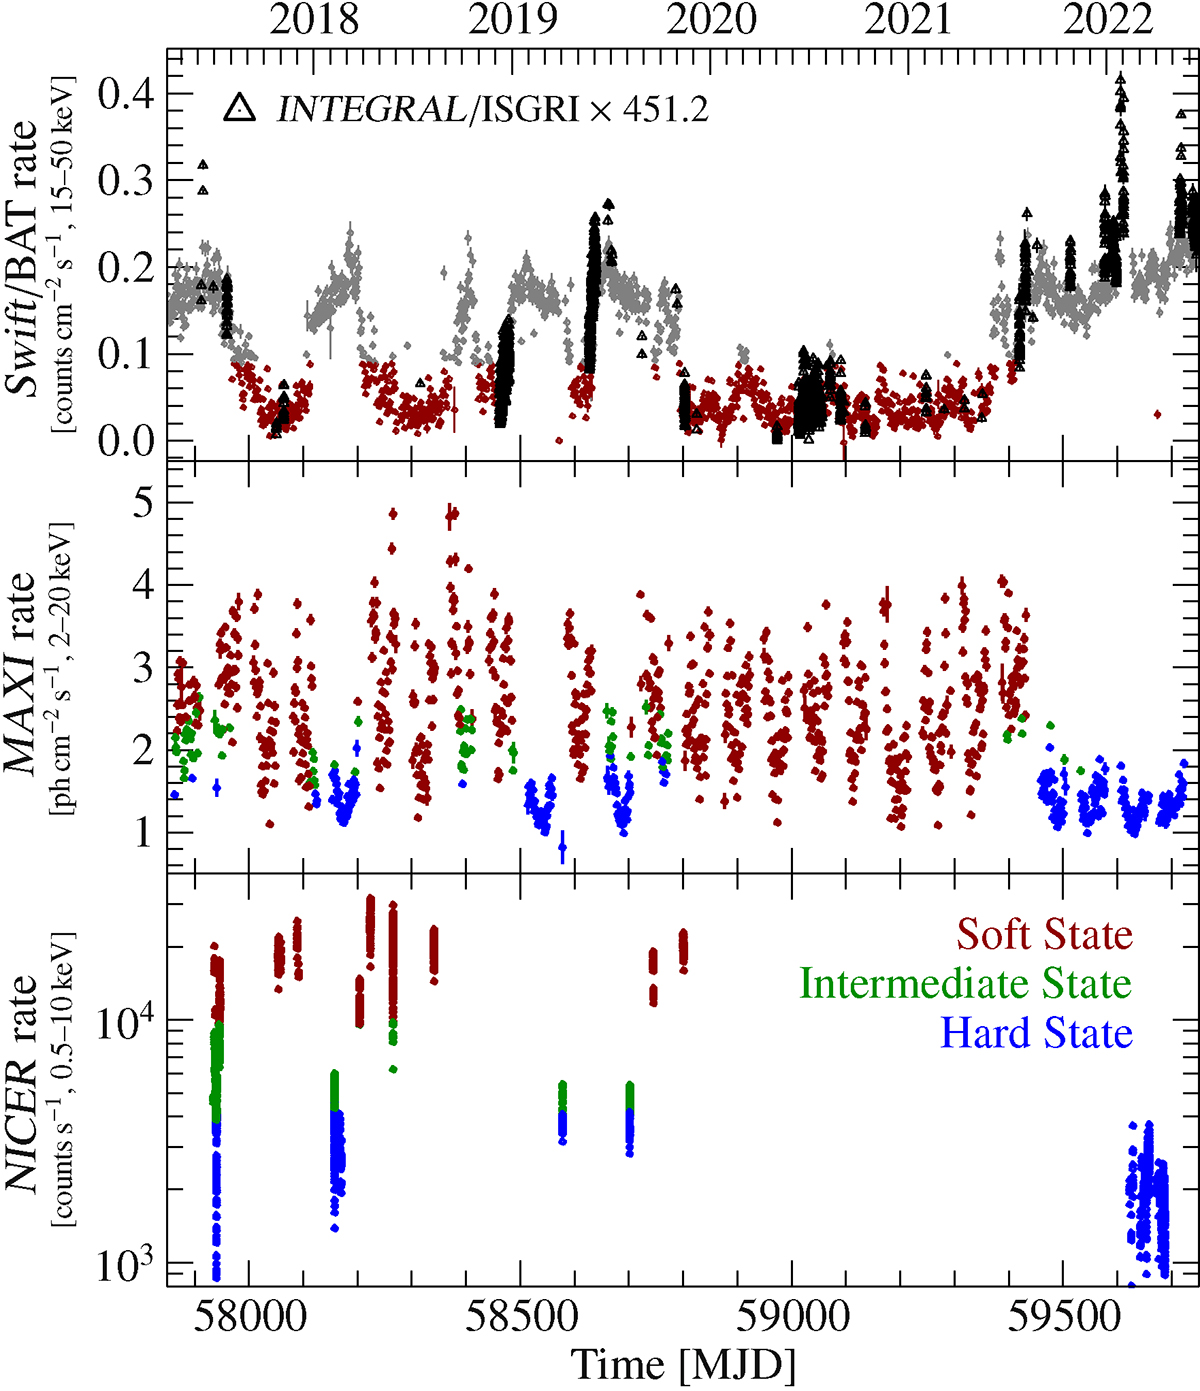
Fig. 3.
Download original image
Swift/BAT, INTEGRAL/ISGRI (top panel), MAXI (center), and NICER (bottom) light curves of Cyg X-1. In the top panel, gray data points denote either the hard or intermediate state as Swift/BAT’s energy range does not allow a further differentiation. Black triangles show INTEGRAL/ISGRI count rates in the 30–50 keV band, showing each science window as one data point. These data are scaled by the ratio of the average BAT and ISGRI count rates over the whole campaign in order to align them with the Swift/BAT data.
Current usage metrics show cumulative count of Article Views (full-text article views including HTML views, PDF and ePub downloads, according to the available data) and Abstracts Views on Vision4Press platform.
Data correspond to usage on the plateform after 2015. The current usage metrics is available 48-96 hours after online publication and is updated daily on week days.
Initial download of the metrics may take a while.