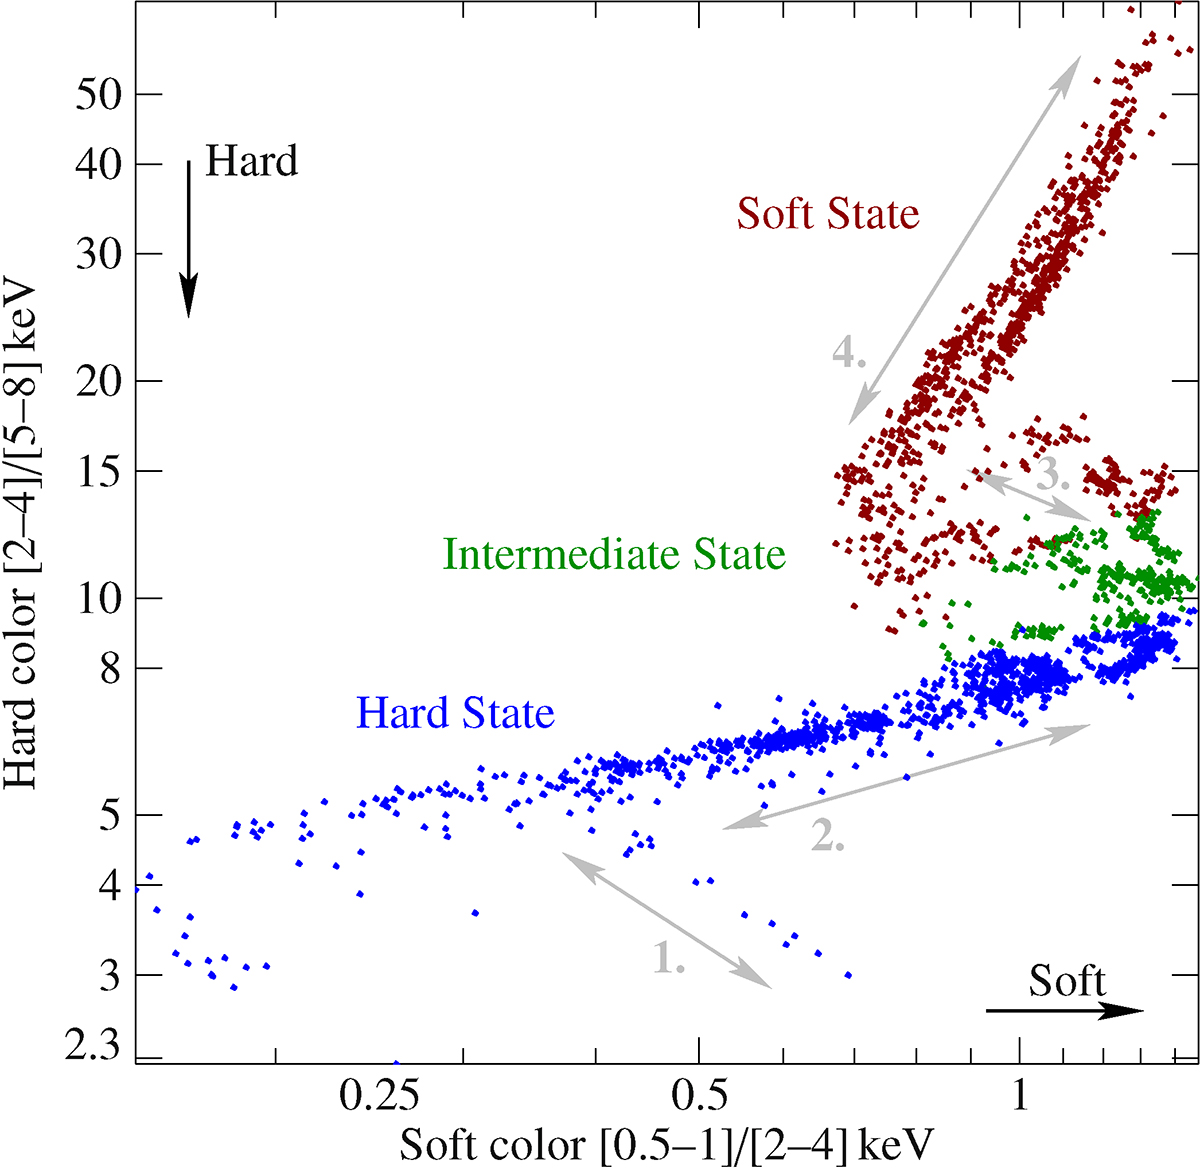
Fig. 4.
Download original image
Color-color diagram of Cyg X-1. The diagram shows distinct regions where the source undergoes several turns. Numbered gray arrows indicate preferred tracks which Cyg X-1 follows when transitioning between the hard and the soft state. Some observations in the hard state show “nose”-shaped tracks where the color-color bends down towards a harder spectral shape (“1.”), which is called dipping. When Cyg X-1 softens, the source shows large variations dominantly in soft color (“2.”). As the source transitions through the intermediate into the soft state, it follows a distinct zig-zag shape driven by the soft color (“3.”). When Cyg X-1 is in the pure soft state, it still ranges significantly in hard color (“4.”).
Current usage metrics show cumulative count of Article Views (full-text article views including HTML views, PDF and ePub downloads, according to the available data) and Abstracts Views on Vision4Press platform.
Data correspond to usage on the plateform after 2015. The current usage metrics is available 48-96 hours after online publication and is updated daily on week days.
Initial download of the metrics may take a while.