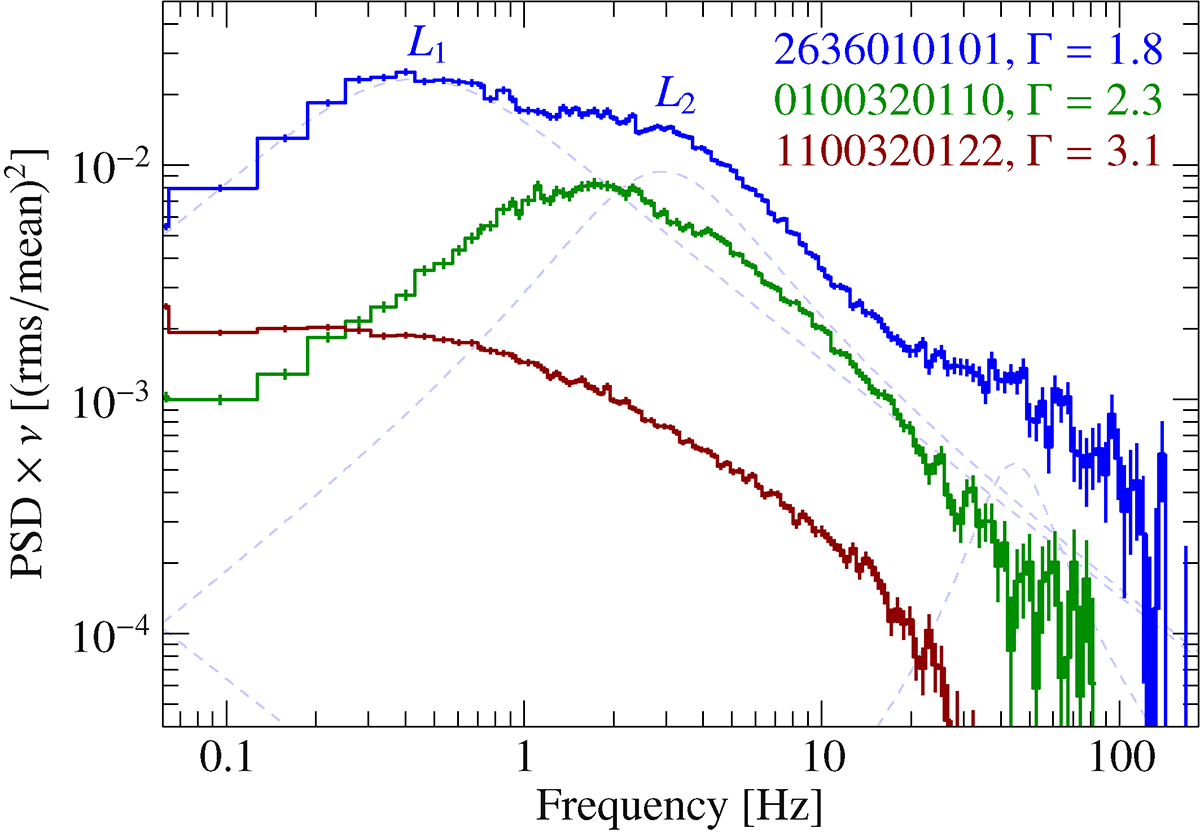
Fig. 6.
Download original image
Power spectral densities in the 0.5–10 keV band of three representative observations of Cyg X-1 associated with the hard (blue) and soft spectral state (red). Observation 0100320110 at Γ ∼ 2.3 is in the transition region between these states (green). The hard state can be characterized by strong broad band noise that can be resolved into multiple Lorentzian components (blue dashed lines). The two most prominent Lorentzians, L1 and L2, are labeled. In the transition, Cyg X-1 exhibits roughly a single broad component. The soft state shows almost featureless red noise.
Current usage metrics show cumulative count of Article Views (full-text article views including HTML views, PDF and ePub downloads, according to the available data) and Abstracts Views on Vision4Press platform.
Data correspond to usage on the plateform after 2015. The current usage metrics is available 48-96 hours after online publication and is updated daily on week days.
Initial download of the metrics may take a while.