Fig. 7.
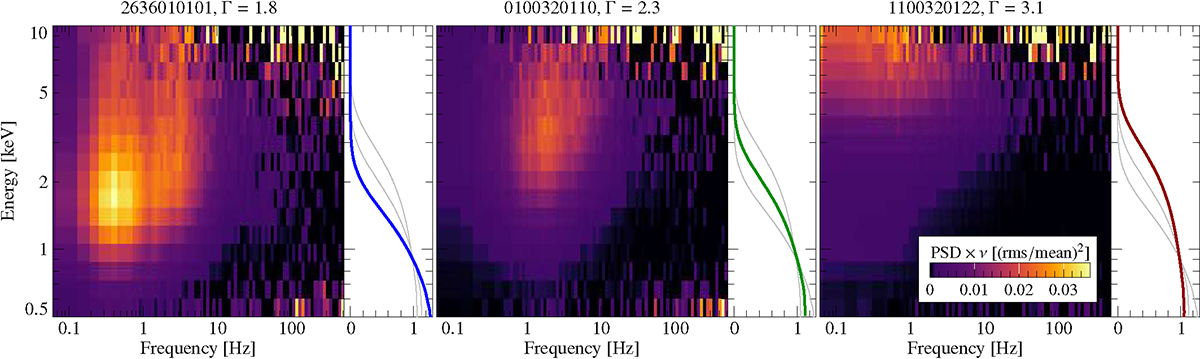
Download original image
Energy-resolved PSDs for three representative observations of Cyg X-1 at different hardness. The blue, green, and red thick lines in the side panels show the relative contribution from the accretion disk (that is, the quantity F(diskbb)/F(simpl ⊗ diskbb)) for the hard (Γ ∼ 1.8), intermediate (Γ ∼ 2.3), and soft state (Γ ∼ 3.1), respectively. The gray lines show the curves of the other states for comparison. Left: in the hard state, the power spectrum peaks at ∼2 keV. It is double-humped at energies ≳1.5 keV while the second hump reduces in amplitude at lower energies. Center: at Γ ∼ 2.3, the PSD has a single-humped structure that peaks at ∼4 keV. The variability peak shifts to higher frequencies compared to the hard state. Right: in the soft state, the PSD is red noise-like and is strongest at the highest energies covered by NICER.
Current usage metrics show cumulative count of Article Views (full-text article views including HTML views, PDF and ePub downloads, according to the available data) and Abstracts Views on Vision4Press platform.
Data correspond to usage on the plateform after 2015. The current usage metrics is available 48-96 hours after online publication and is updated daily on week days.
Initial download of the metrics may take a while.