Open Access
Fig. 8
Download original image
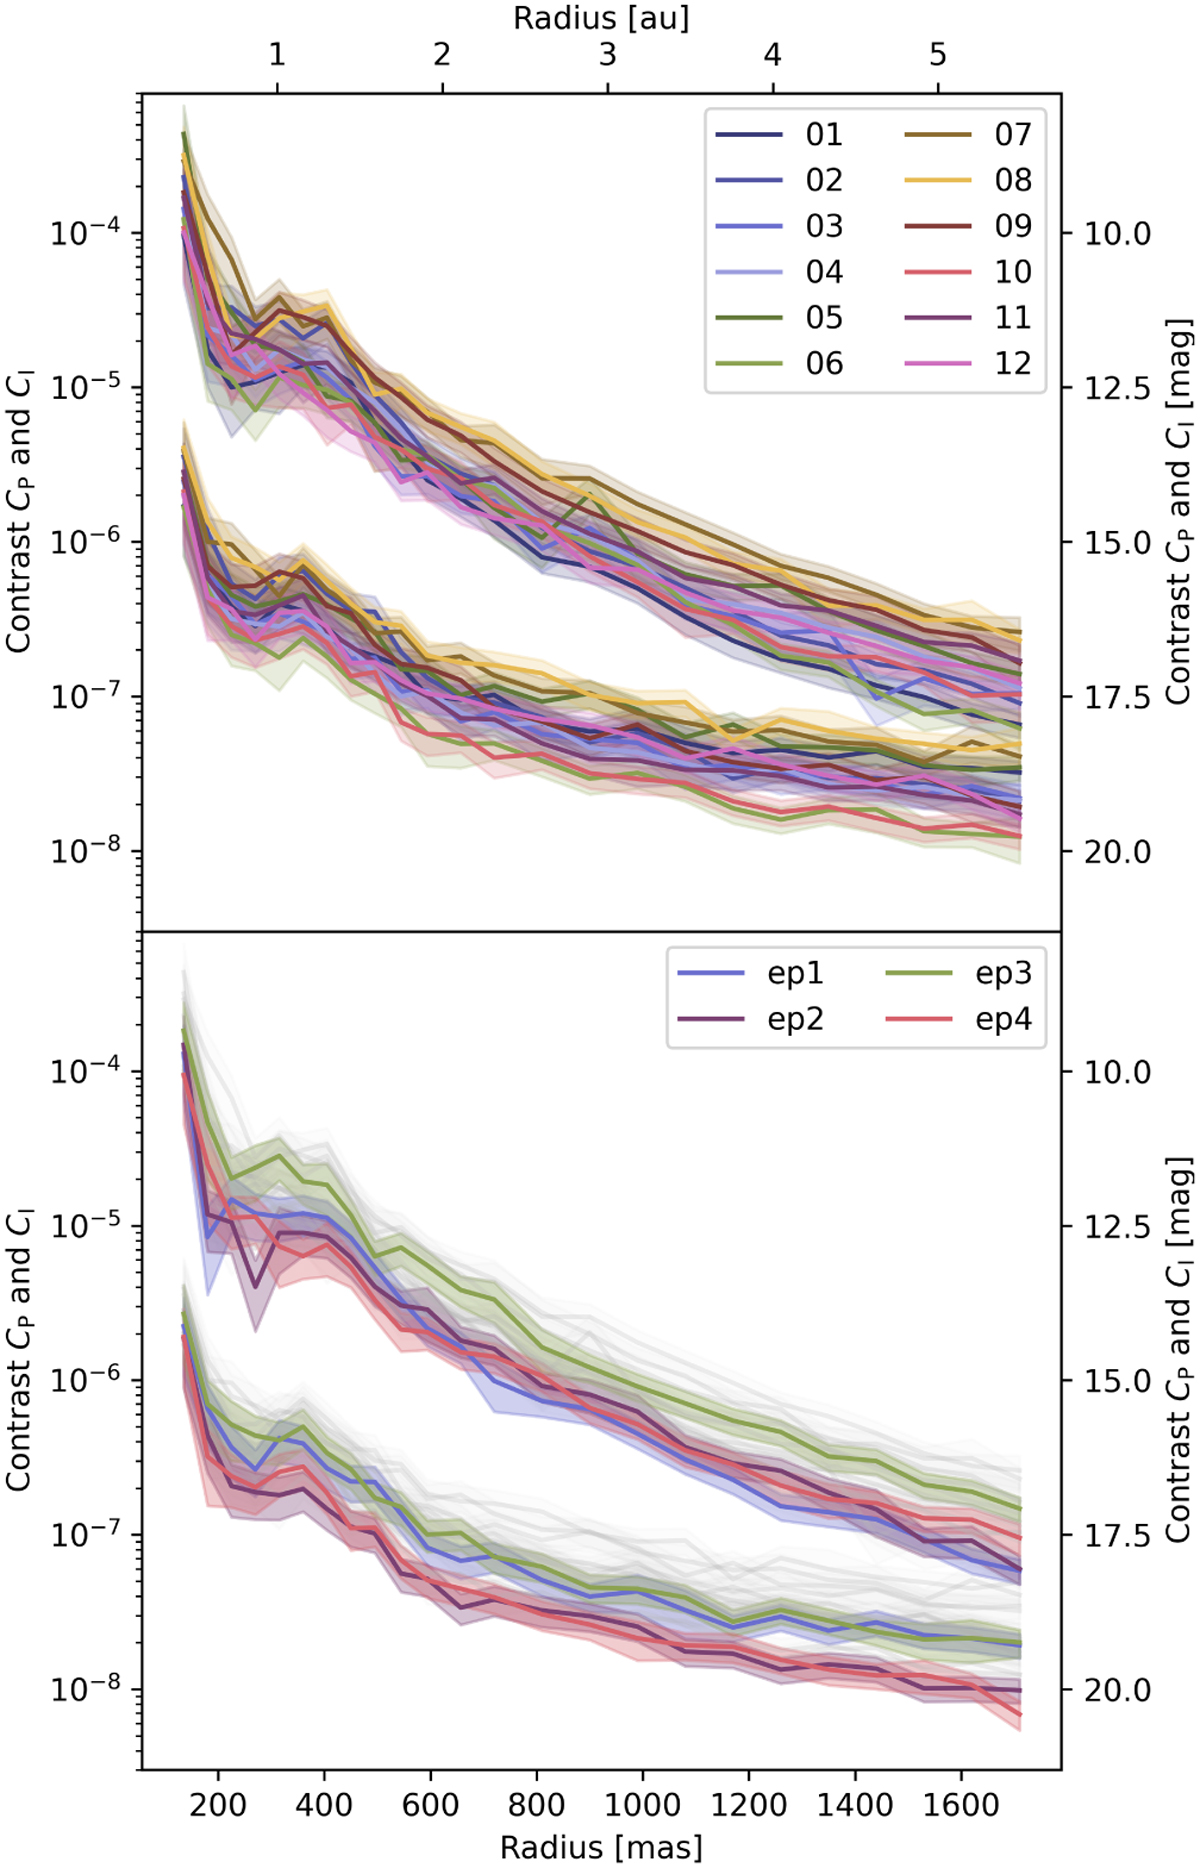
Sensitivity expressed as contrast curves with 5 σ![]() Gaussian significance. Top: individual nights for the intensity CI = Ip/I★ (upper curves), the polarized light CP = pp · Ip/I★ (lower curves). Bottom: the four epochs in colour in comparison to the individual nights in grey.
Gaussian significance. Top: individual nights for the intensity CI = Ip/I★ (upper curves), the polarized light CP = pp · Ip/I★ (lower curves). Bottom: the four epochs in colour in comparison to the individual nights in grey.
Current usage metrics show cumulative count of Article Views (full-text article views including HTML views, PDF and ePub downloads, according to the available data) and Abstracts Views on Vision4Press platform.
Data correspond to usage on the plateform after 2015. The current usage metrics is available 48-96 hours after online publication and is updated daily on week days.
Initial download of the metrics may take a while.