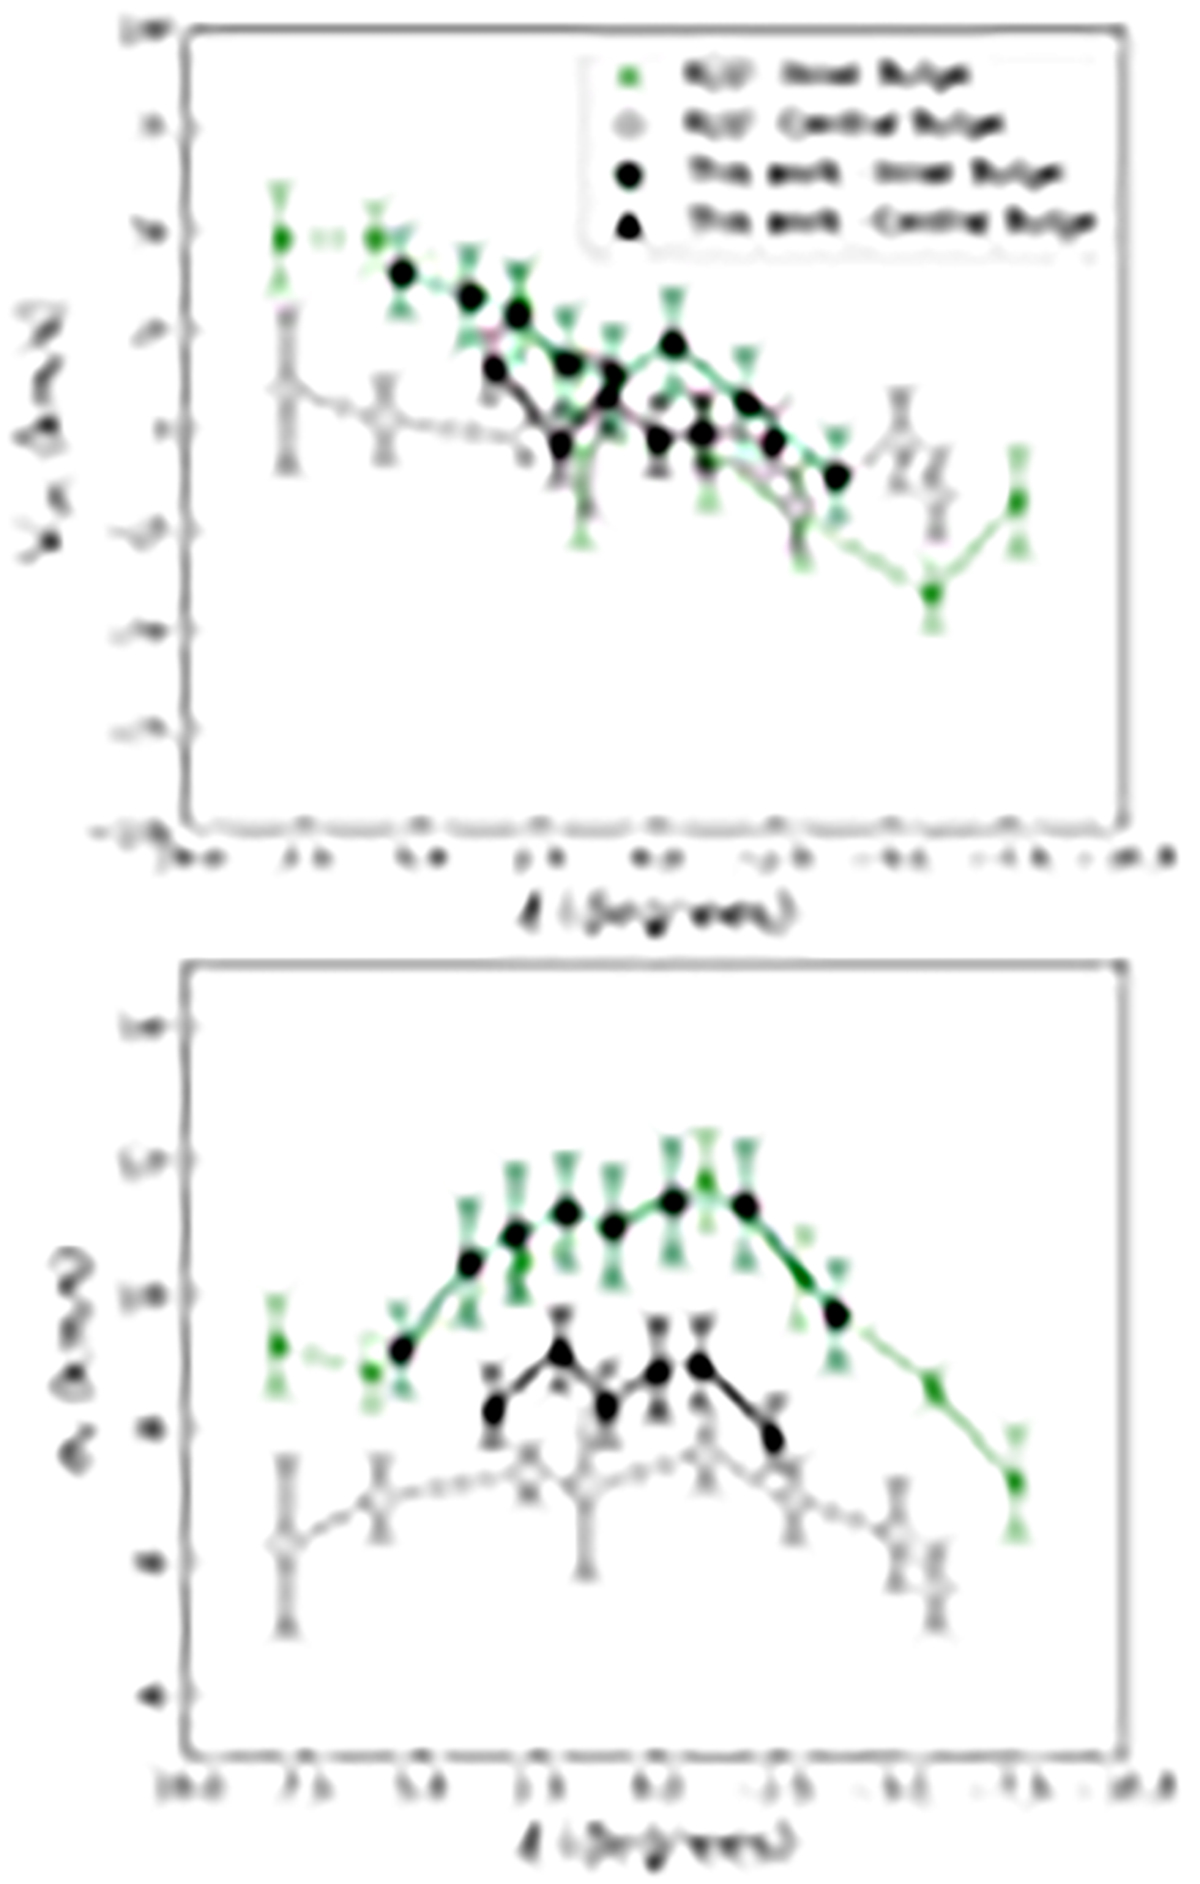
Fig. 10.
Download original image
Kinematics of the bulge RRLs compared with the results of K22. Top panel: rotation curve of the bulge-confined RRLs of our sample separated into those that are more centrally concentrated (black triangles) and those farther away (green stars). The rotation curves from K22 are also presented for comparison. Green shows the inner bulge and white the central bulge RRLs. We found a similar behaviour where inner bulge RRLs are rotating, and central ones do not show signs of rotation. Bottom panel: velocity dispersion curves for the distributions above. The velocity dispersion curve of the central bulge RRLs is clearly lower than that of the inner bulge ones, and it is flatter for both cases. On the other hand, the inner bulge ones show a velocity dispersion very similar to that of bulge giants (see Fig. 7).
Current usage metrics show cumulative count of Article Views (full-text article views including HTML views, PDF and ePub downloads, according to the available data) and Abstracts Views on Vision4Press platform.
Data correspond to usage on the plateform after 2015. The current usage metrics is available 48-96 hours after online publication and is updated daily on week days.
Initial download of the metrics may take a while.