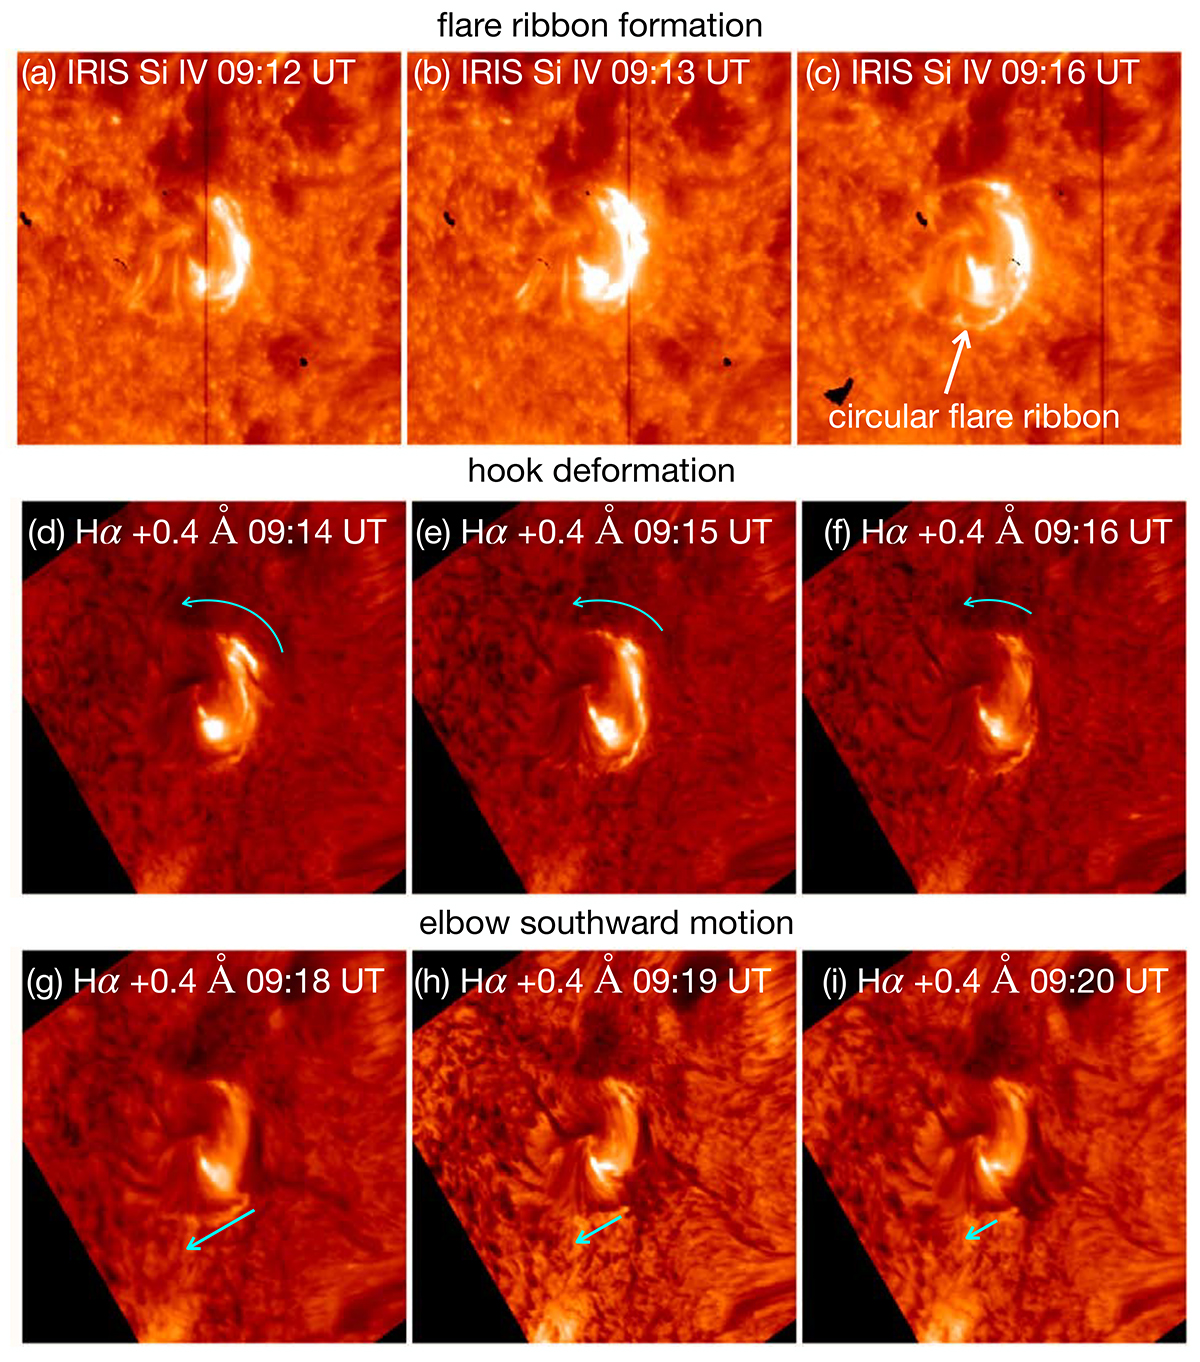
Fig. 3.
Download original image
Impulsive phase observation. This energy release phase is shown in three stages. The top row shows the circular flare ribbon formation in IRIS Si IV observations. The middle row shows the deformation of the hook brightening in the Hα red wing and is indicated with curved cyan arrows. The bottom row shows the southward motion of the dark elbow-shaped structure in the Hα red wing and is depicted with the shortening of the arrow length.
Current usage metrics show cumulative count of Article Views (full-text article views including HTML views, PDF and ePub downloads, according to the available data) and Abstracts Views on Vision4Press platform.
Data correspond to usage on the plateform after 2015. The current usage metrics is available 48-96 hours after online publication and is updated daily on week days.
Initial download of the metrics may take a while.