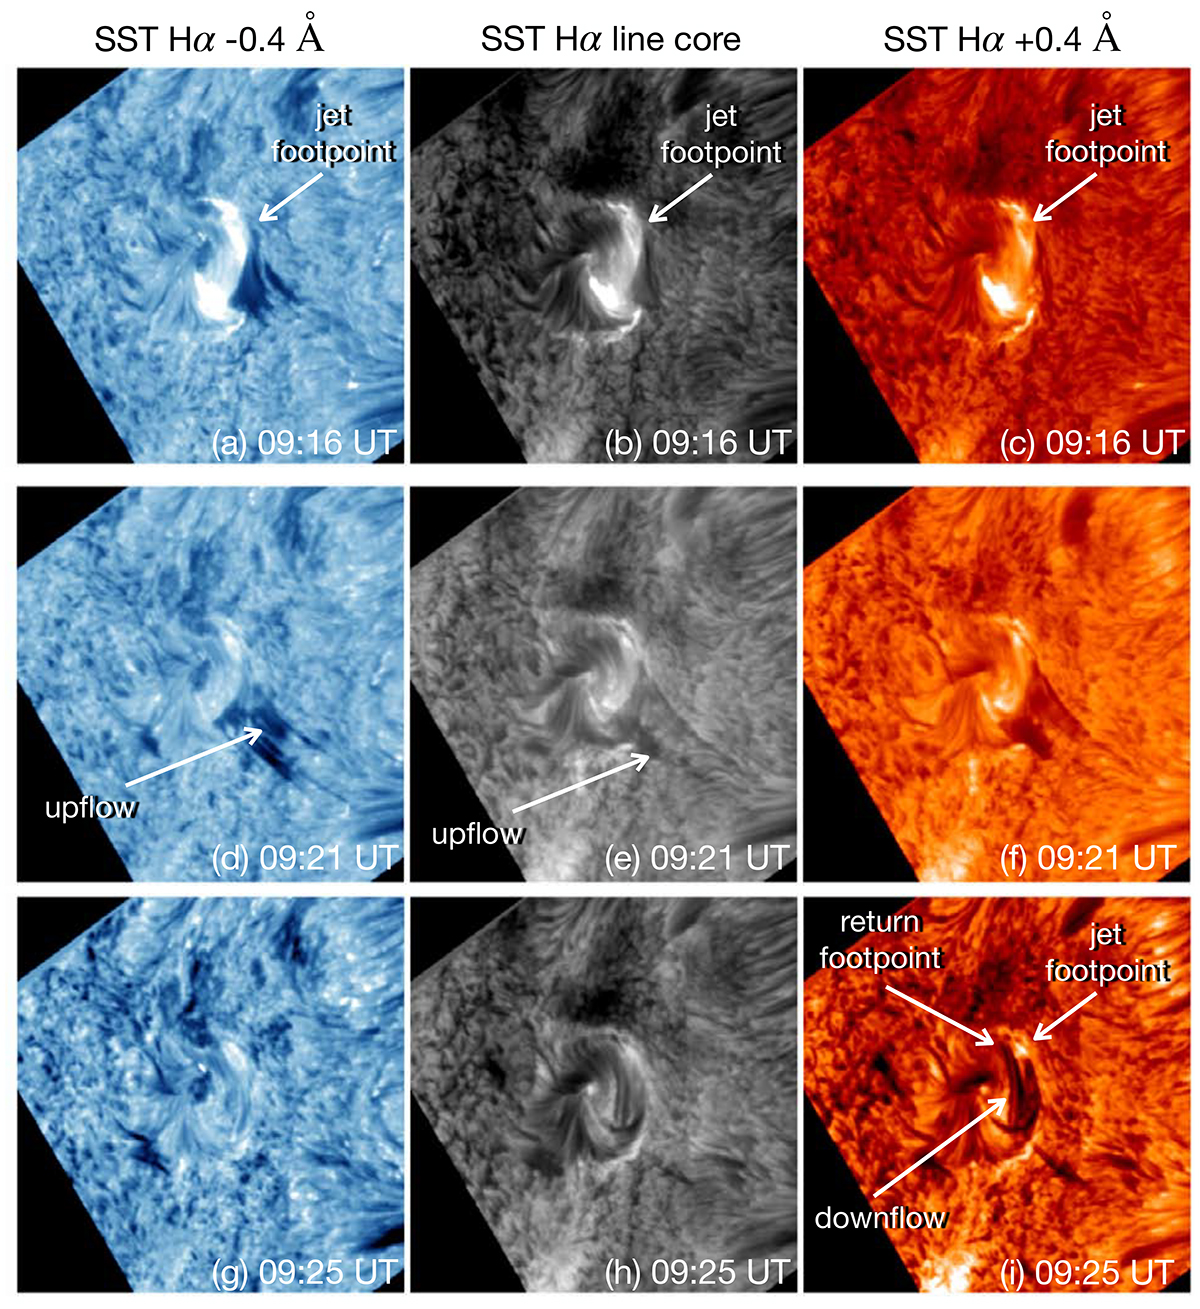
Fig. 4.
Download original image
Recovery phase observation. This is the last phase of the jet eruption. The up- and downflow of the jet plasma is shown in the SST Hα blue wing (first column), line core 6563 Å (middle column), and red wing (last column) observations. The initial jet footpoint is shown in the first row and is where the jet starts to erupt as a wide upflow shown in panels d and e. Some parts of the jet material fell back at a different location: “return footpoint”, shown in panel i.
Current usage metrics show cumulative count of Article Views (full-text article views including HTML views, PDF and ePub downloads, according to the available data) and Abstracts Views on Vision4Press platform.
Data correspond to usage on the plateform after 2015. The current usage metrics is available 48-96 hours after online publication and is updated daily on week days.
Initial download of the metrics may take a while.