Fig. 6.
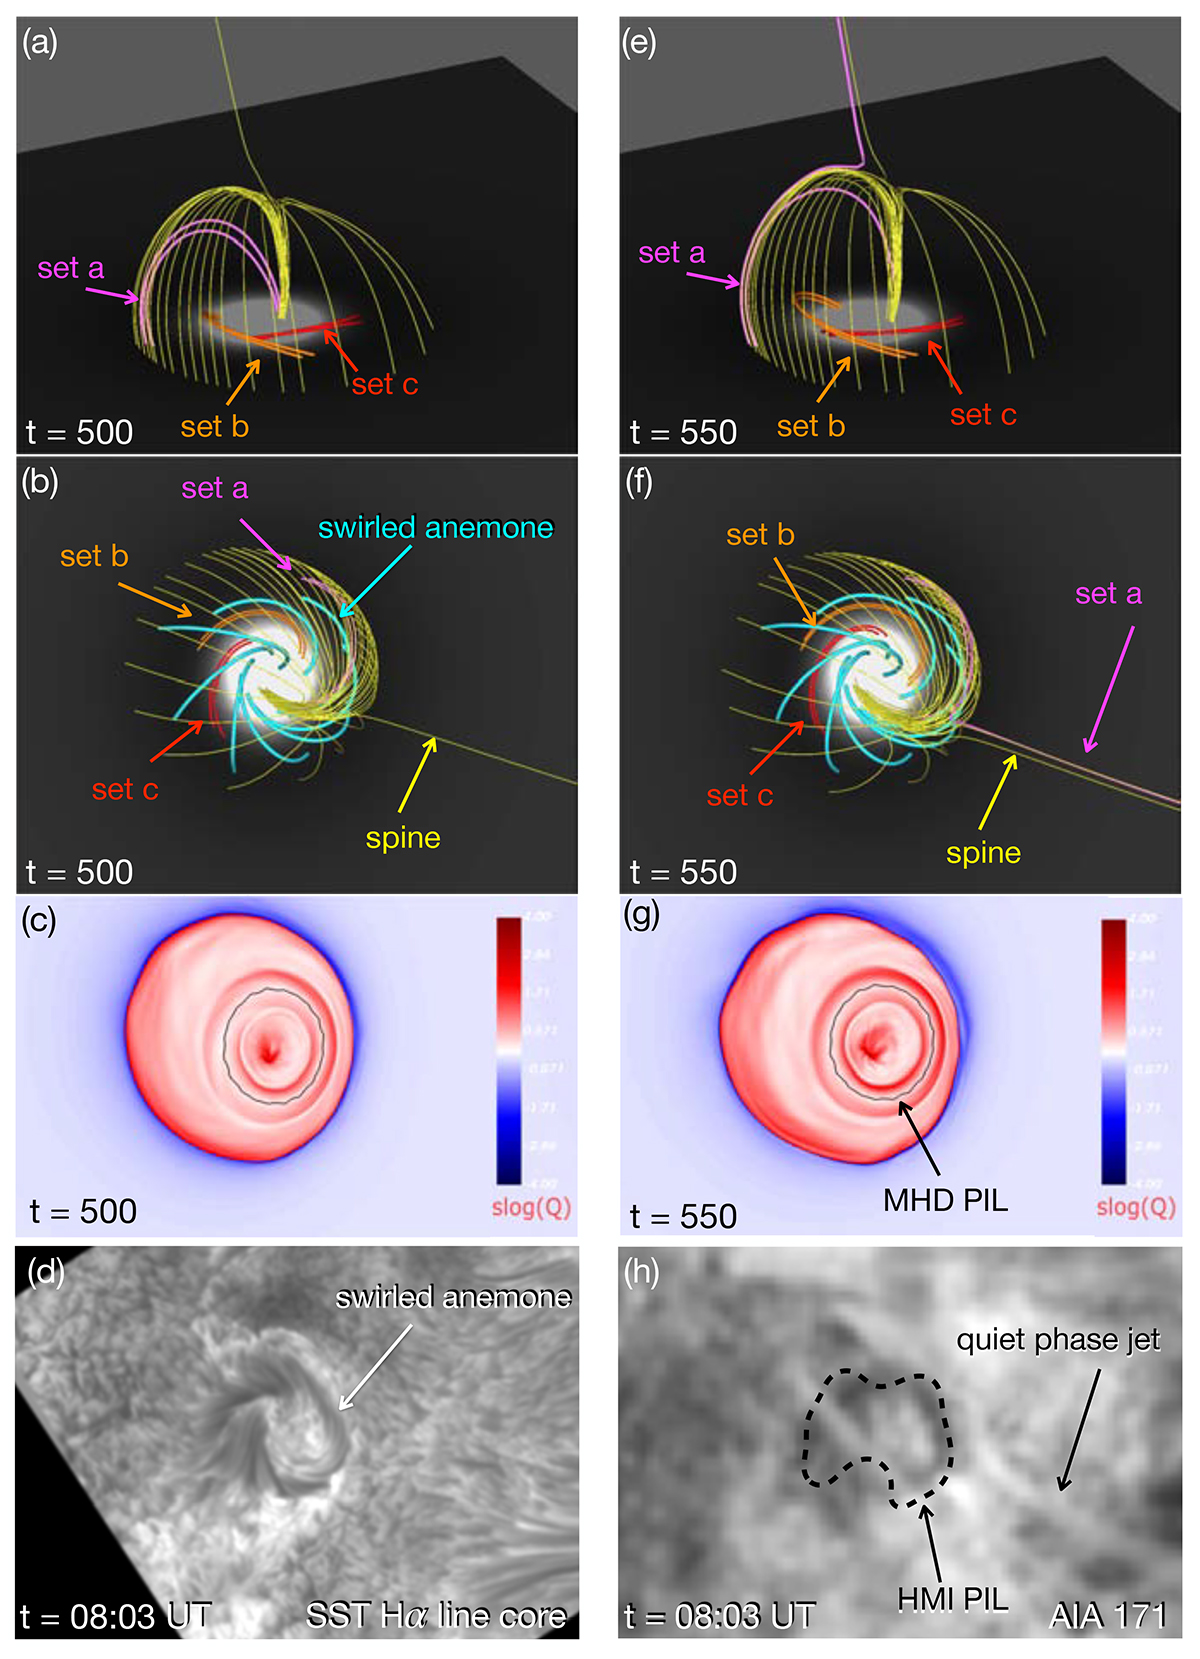
Download original image
Modelling versus observations phase I. The rows are as follows: early reconnection phase in the ARMS simulation (first and second row), QSL calculations (third row), and in observations (last row). The first row is the field line view from the side, and the second and third rows have the same orientation as the observations. The swirled-anemone shape in the simulation is shown in panel b around the MHD PIL explained in the QSL map in panel g. The similar shape in observation is shown in the SST Hα line core observations (panel d) around the HMI PIL overplotted in AIA 171 Å (panel h).
Current usage metrics show cumulative count of Article Views (full-text article views including HTML views, PDF and ePub downloads, according to the available data) and Abstracts Views on Vision4Press platform.
Data correspond to usage on the plateform after 2015. The current usage metrics is available 48-96 hours after online publication and is updated daily on week days.
Initial download of the metrics may take a while.