Open Access
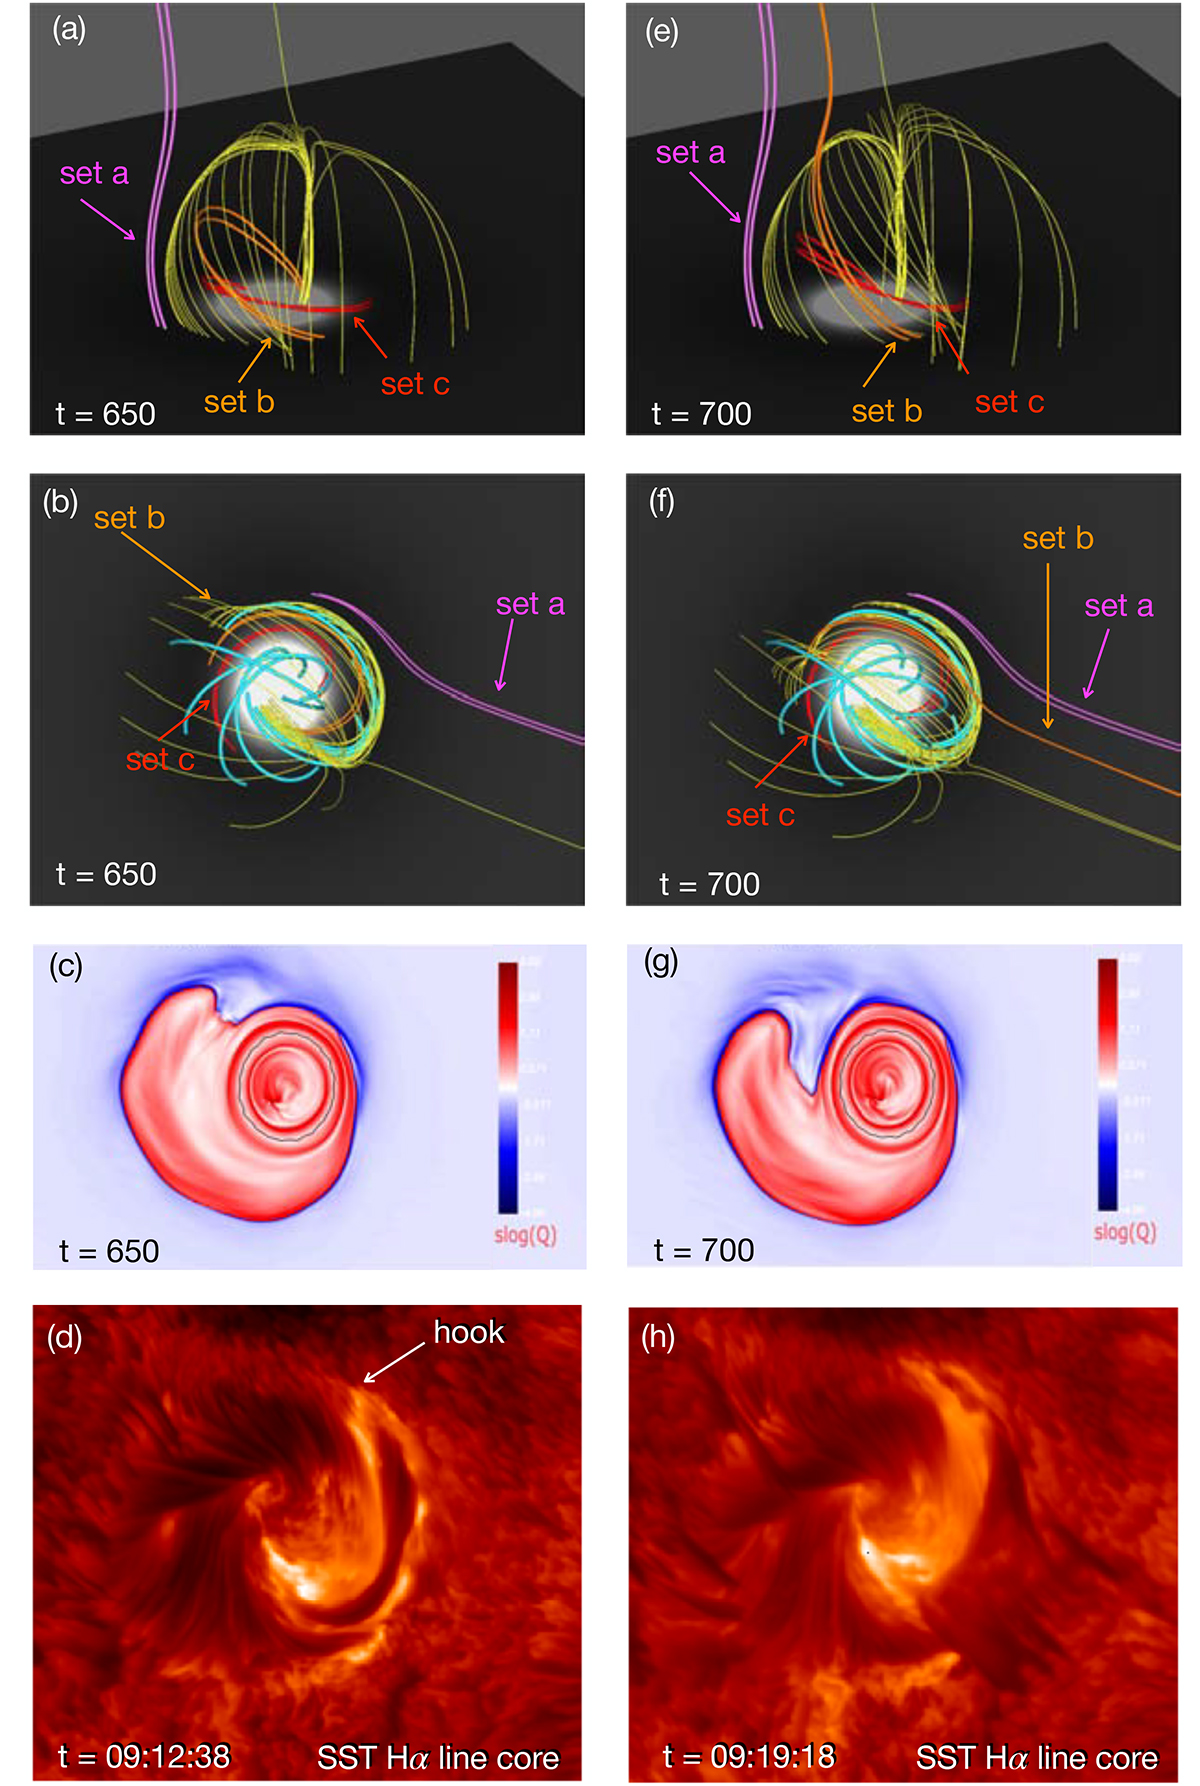
Fig. 7.
Download original image
Modelling versus observations phase II. The rows are as follows: the impulsive phase of the jet in the field line simulation from a side view (first row), an observational view (second row), the squashing factor maps (third row), and SST Hα line core observations (last row).
Current usage metrics show cumulative count of Article Views (full-text article views including HTML views, PDF and ePub downloads, according to the available data) and Abstracts Views on Vision4Press platform.
Data correspond to usage on the plateform after 2015. The current usage metrics is available 48-96 hours after online publication and is updated daily on week days.
Initial download of the metrics may take a while.