Fig. 8.
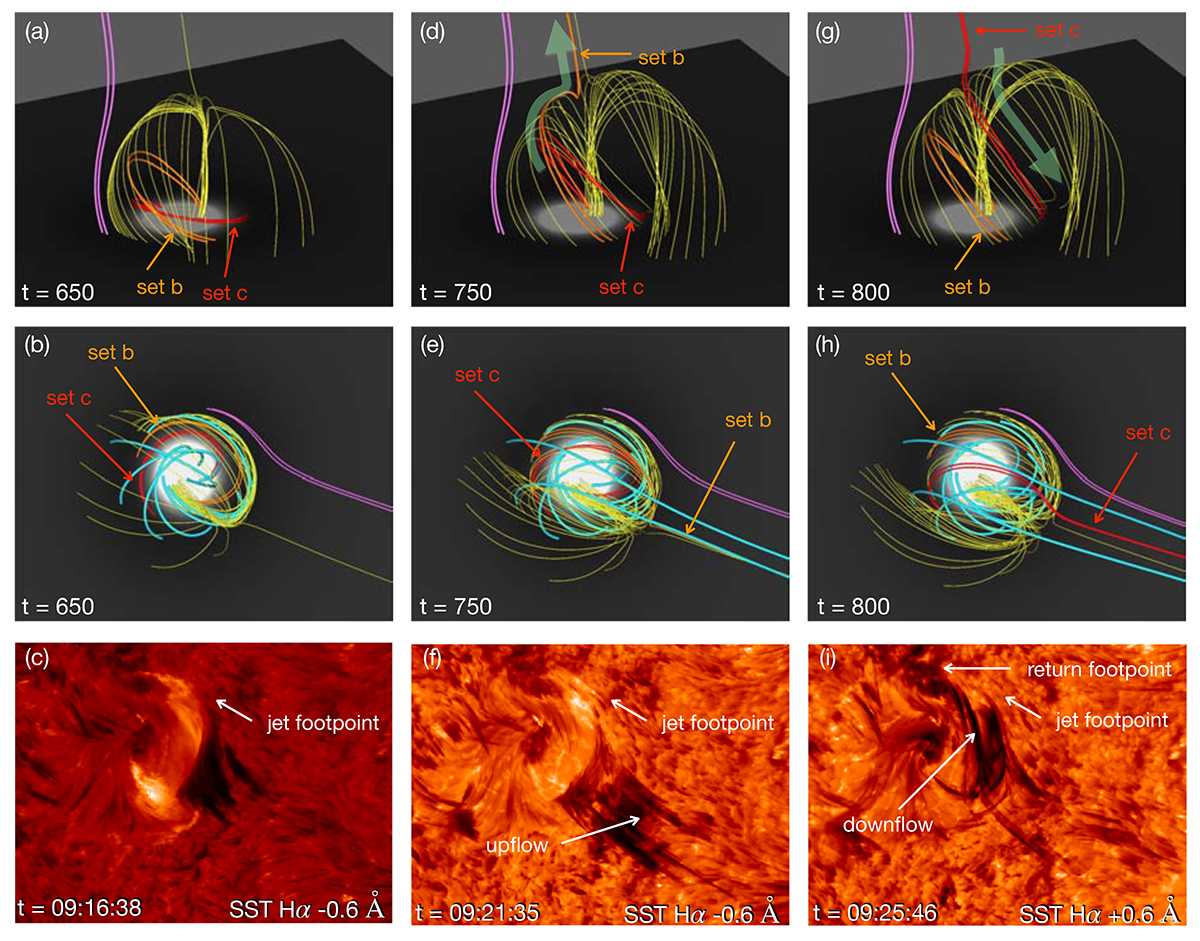
Download original image
Modelling versus observations phase III. This was the last stage of the jet eruption, where a part of the jet material fell back on a different footpoint than the initial footpoint. The first row is the side view of the simulated field lines, the second row is the observational view of the simulation, and the third row presents the Hα observations in the blue (panels c, f) and red (panel i) wing. The thick green arrow in panel d shows the direction of the jet upflow along the open set b field lines, and the arrow in panel g shows the downflow of the jet material along the set c field lines.
Current usage metrics show cumulative count of Article Views (full-text article views including HTML views, PDF and ePub downloads, according to the available data) and Abstracts Views on Vision4Press platform.
Data correspond to usage on the plateform after 2015. The current usage metrics is available 48-96 hours after online publication and is updated daily on week days.
Initial download of the metrics may take a while.