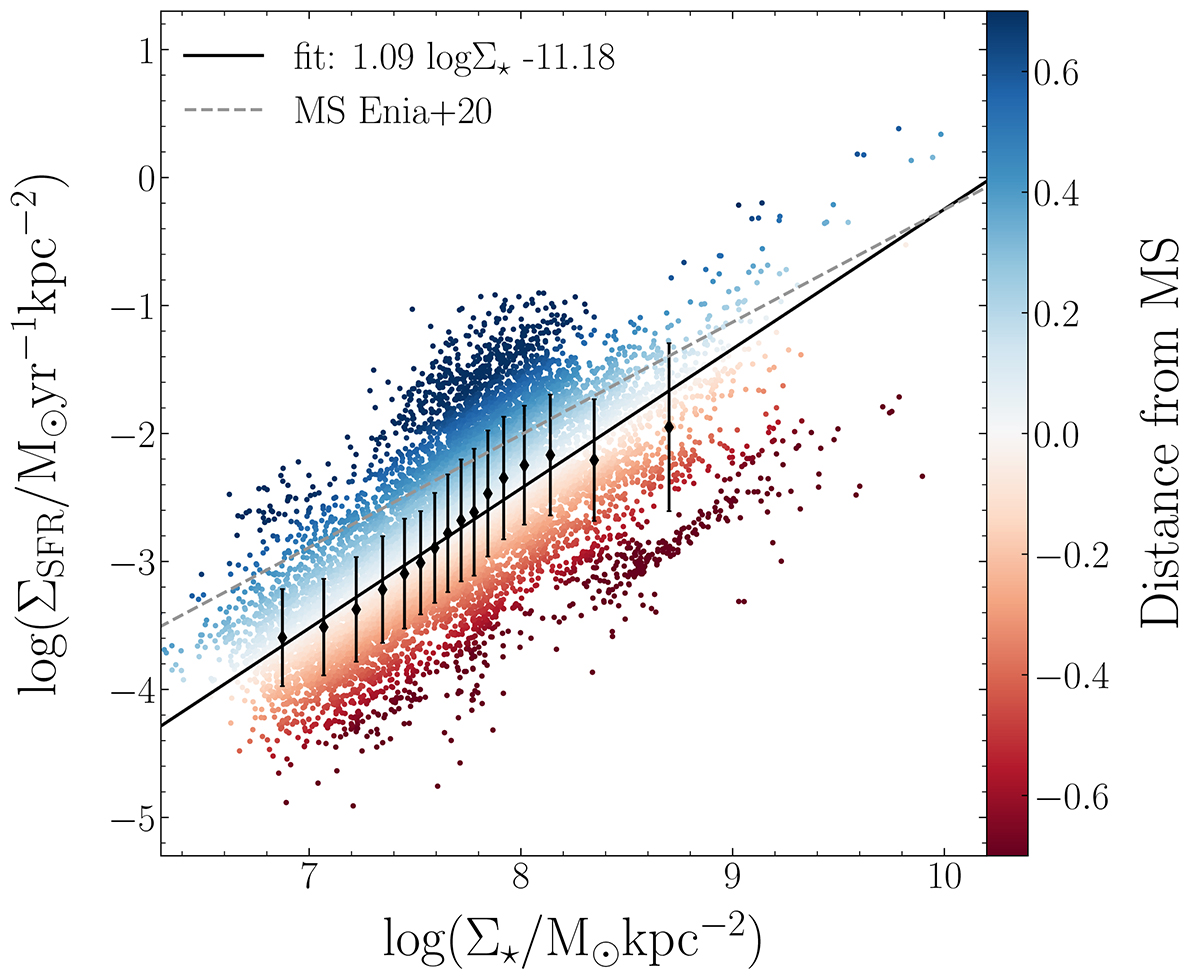
Fig. 4.
Download original image
Overall MS relation. Each point represents the values of the stellar mass and SFR surface density of an accepted cell in one of the six galaxies of our sample. These points are colour coded as a function of their distance from the MS (black solid line), which is derived from the linear fit of the black points, which are marked with thin diamonds. The error bars correspond to the standard deviation of the data points in each bin. The grey dashed line represents the best-fit MS obtained in Enia et al. (2020) for a sample of unbarred spiral galaxies.
Current usage metrics show cumulative count of Article Views (full-text article views including HTML views, PDF and ePub downloads, according to the available data) and Abstracts Views on Vision4Press platform.
Data correspond to usage on the plateform after 2015. The current usage metrics is available 48-96 hours after online publication and is updated daily on week days.
Initial download of the metrics may take a while.