Fig. 3
Download original image
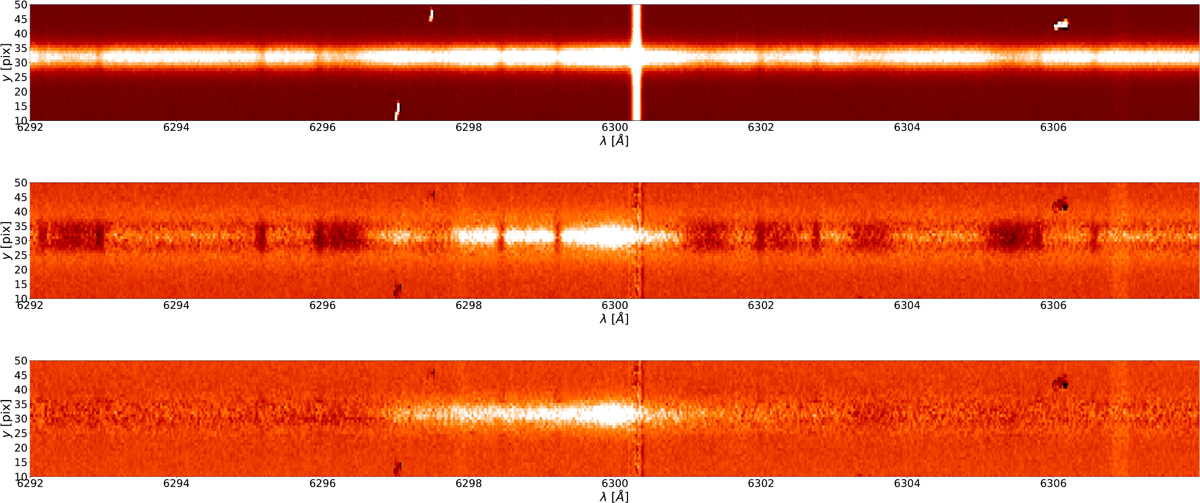
Illustration of the correction steps involved for the spectro-astrometric anylysis of the [OI]λ6300 emission line. All rows are showing the same 2D data of Sz 98 in slit position 3 at consecutive data reduction steps. Top: the combined 2D data after the reduction with the ESOREFLEX/UVES workflow is shown. The continuum contribution of the star plus the line emission is seen as a bright horizontal stripe between the pixel rows y = 25–40 pix. The continuum of Sz 98 displays several absorption features. The narrow absorption lines are tellurics and the broader lines are originating from the photosphere of Sz 98. The bright oxygen night-skyline at about 6300 Å is prominently present as a vertical bright stripe in the spectrum. The impact of three cosmics is seen in the spectral region between 6296 Å and 6298 Å as well as at about 6306 Å. Middle: the night-skyline and the cosmics have been removed. The continuum contribution (2D Gaussian) of Sz 98 has been removed without correcting for telluric and photospheric absorption lines. Bottom: the continuum contribution of Sz 98 has been removed (2D Voigt profile) including the correction for tellurics and photospherics row-by-row (1D correction in Fig. 2). A spectro-astrometric analysis is done by fitting 1D Gaussians in spatial direction to the remaining [OI]λ6300 emission, which is displayed in Figs. D.1–D.34.
Current usage metrics show cumulative count of Article Views (full-text article views including HTML views, PDF and ePub downloads, according to the available data) and Abstracts Views on Vision4Press platform.
Data correspond to usage on the plateform after 2015. The current usage metrics is available 48-96 hours after online publication and is updated daily on week days.
Initial download of the metrics may take a while.