Fig. 5
Download original image
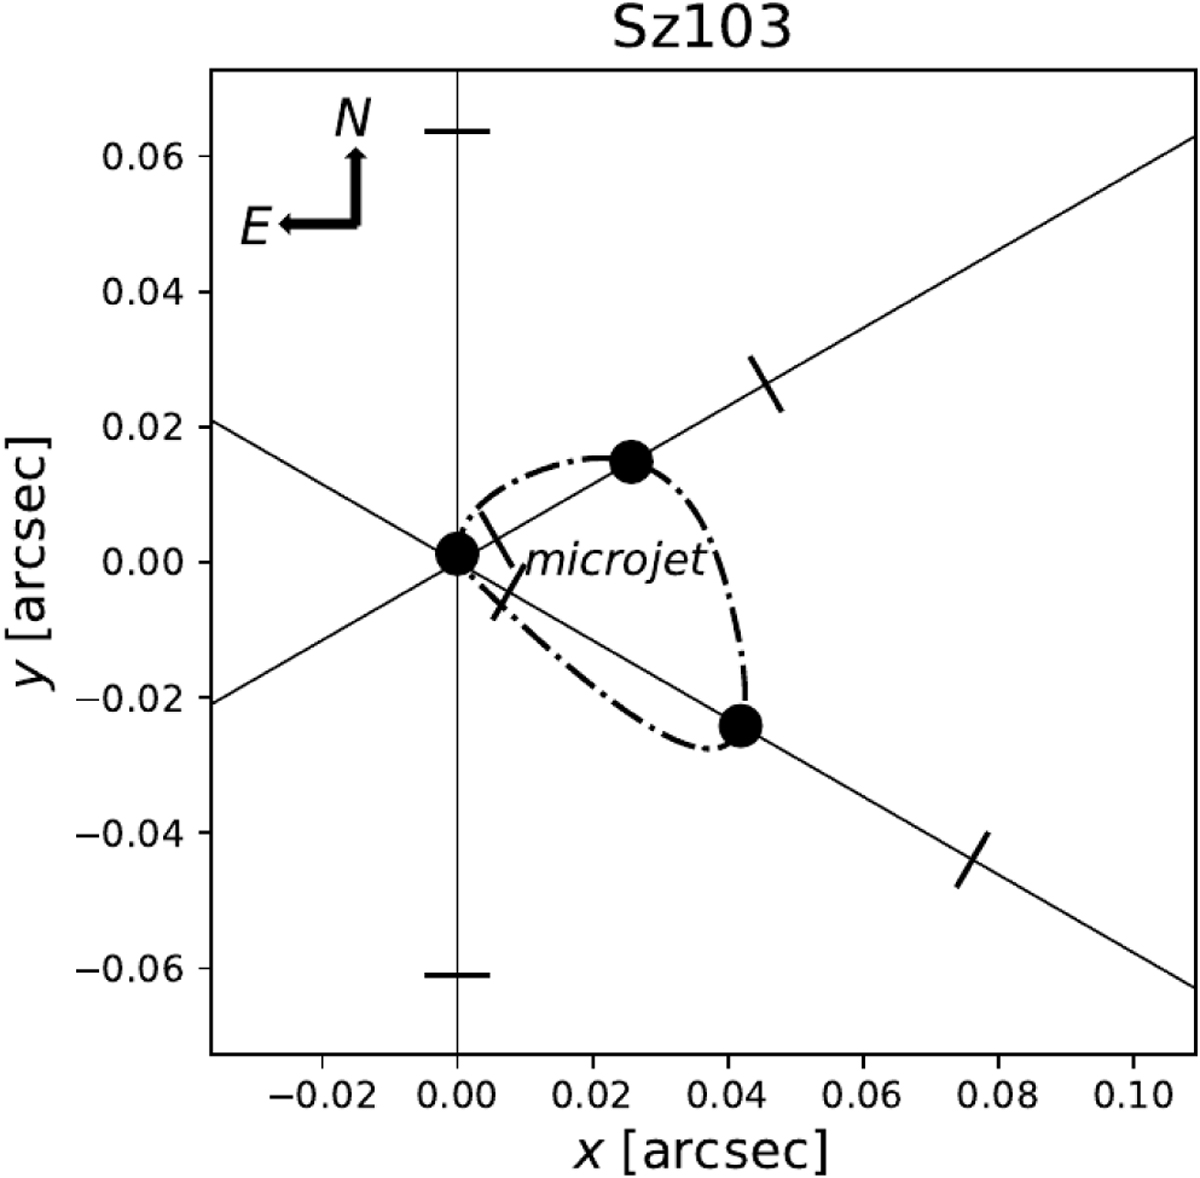
Microjet of Sz 103. The three UVES slit position angles are indicated as solid lines. For each slit position the spectro-astrometric offset in the [OI]λ6300 emission line is indicated as filled circle together with their 1σ error bars (thick lines). We determined its position by calculating the mean of all offsets (1D Gaussians) with respect to the continuum between v = −80 … 10 km s−1 (see Fig. D.11). We interpolated a quadratic curve that connects the mean detected positions of the spectro-astrometric offsets. It thus represents a lower limit of the extension of the microjet.
Current usage metrics show cumulative count of Article Views (full-text article views including HTML views, PDF and ePub downloads, according to the available data) and Abstracts Views on Vision4Press platform.
Data correspond to usage on the plateform after 2015. The current usage metrics is available 48-96 hours after online publication and is updated daily on week days.
Initial download of the metrics may take a while.