Fig. 11
Download original image
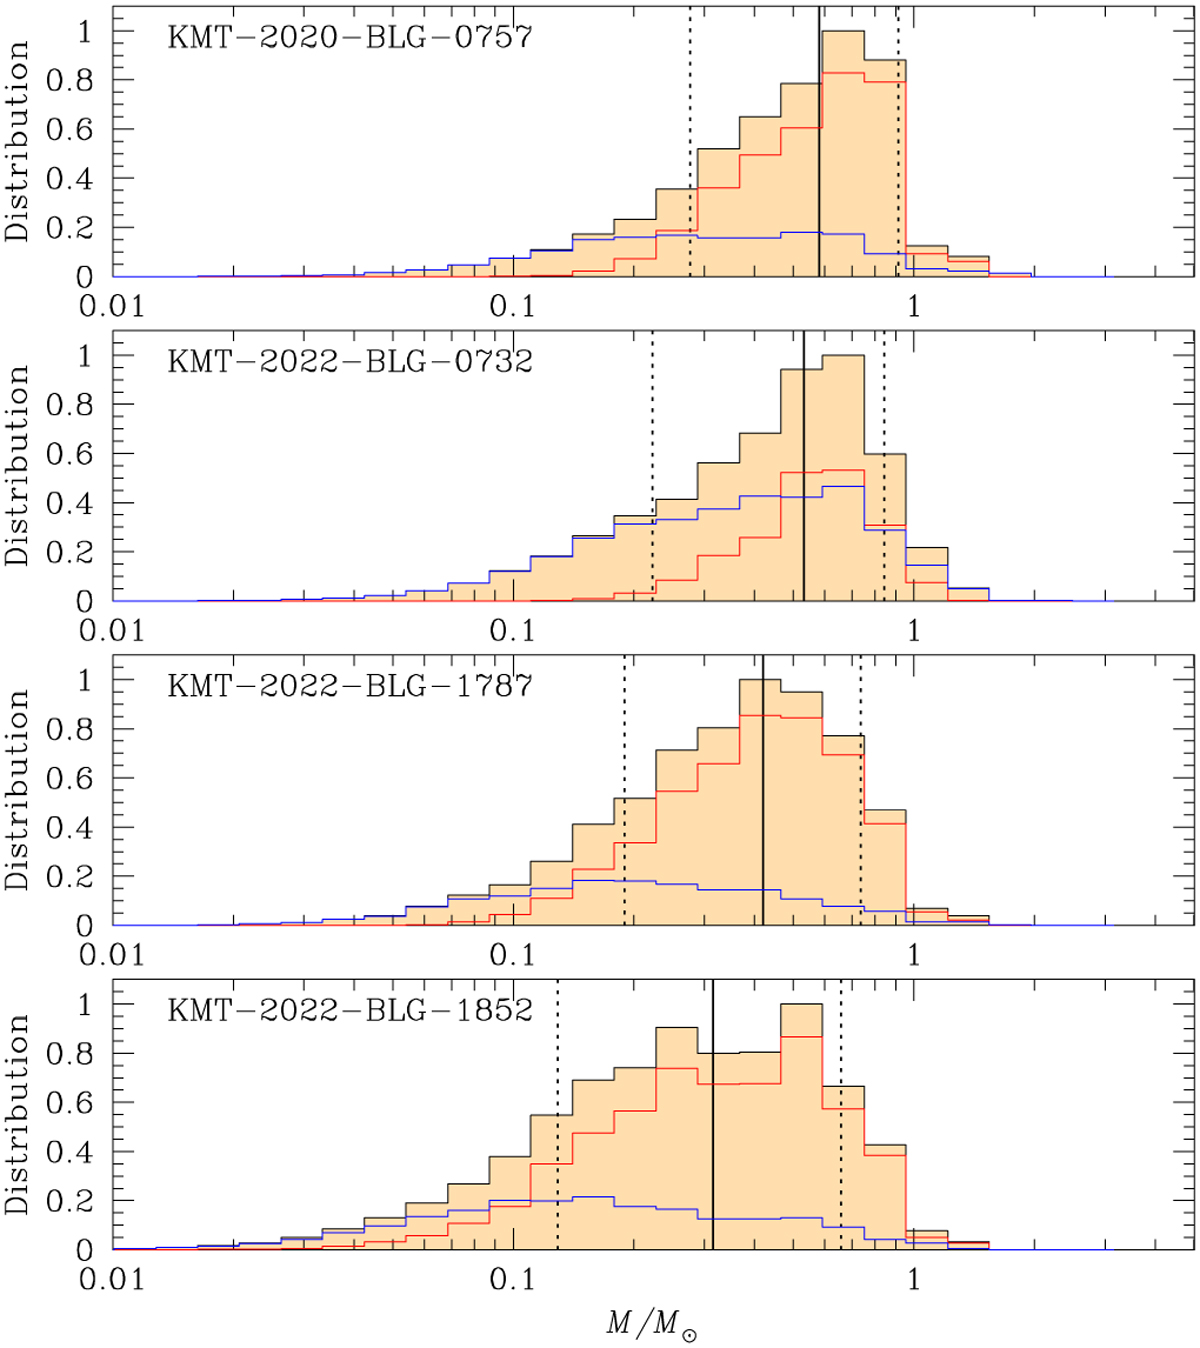
Posteriors for the masses of the planetary systems estimated from Bayesian analyses. Within each distribution, the median value is denoted by a solid vertical line, while the uncertainty range is depicted by two dotted vertical lines. The contributions from the disk and bulge lens populations are respectively shown in blue and red curves, with the combined contribution represented by the black curve.
Current usage metrics show cumulative count of Article Views (full-text article views including HTML views, PDF and ePub downloads, according to the available data) and Abstracts Views on Vision4Press platform.
Data correspond to usage on the plateform after 2015. The current usage metrics is available 48-96 hours after online publication and is updated daily on week days.
Initial download of the metrics may take a while.