Fig. D.2
Download original image
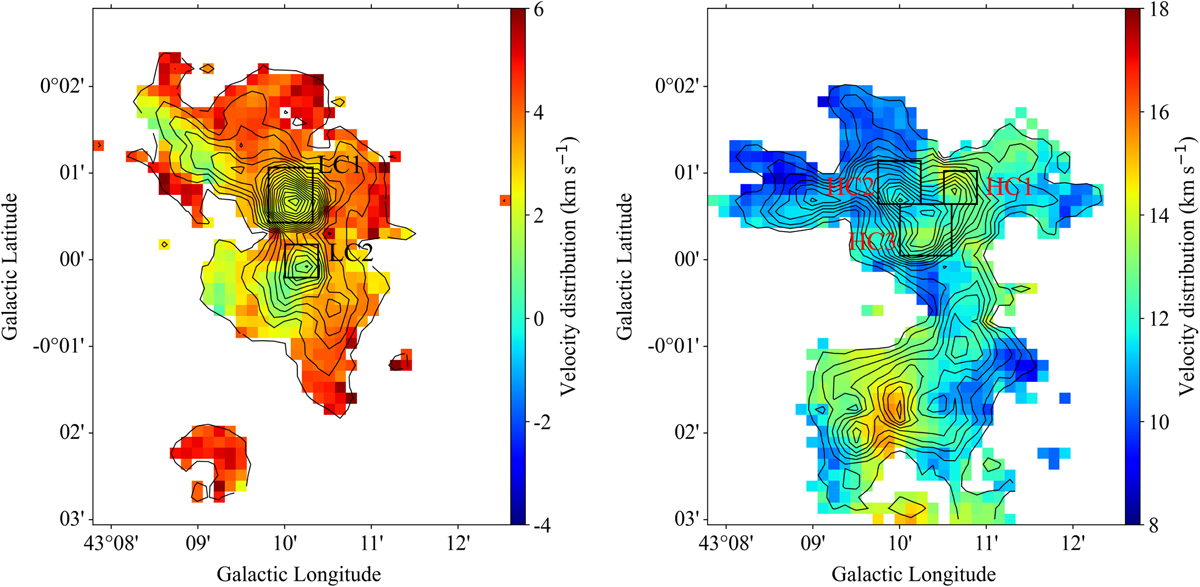
Dense clumps in the hubs of B-S and R-S. Left panel: Color map of the 13CO (3–2) velocity distribution of the B-S component. The black outlines are the intensity contours, and the black boxes are the extents of the two dense clumps. Right panel: Color map of the 13CO (3–2) velocity distribution of the R-S component. The black outlines are the intensity contours, and the black boxes are the extent of the three dense clumps of the R-S component.
Current usage metrics show cumulative count of Article Views (full-text article views including HTML views, PDF and ePub downloads, according to the available data) and Abstracts Views on Vision4Press platform.
Data correspond to usage on the plateform after 2015. The current usage metrics is available 48-96 hours after online publication and is updated daily on week days.
Initial download of the metrics may take a while.