Fig. 2
Download original image
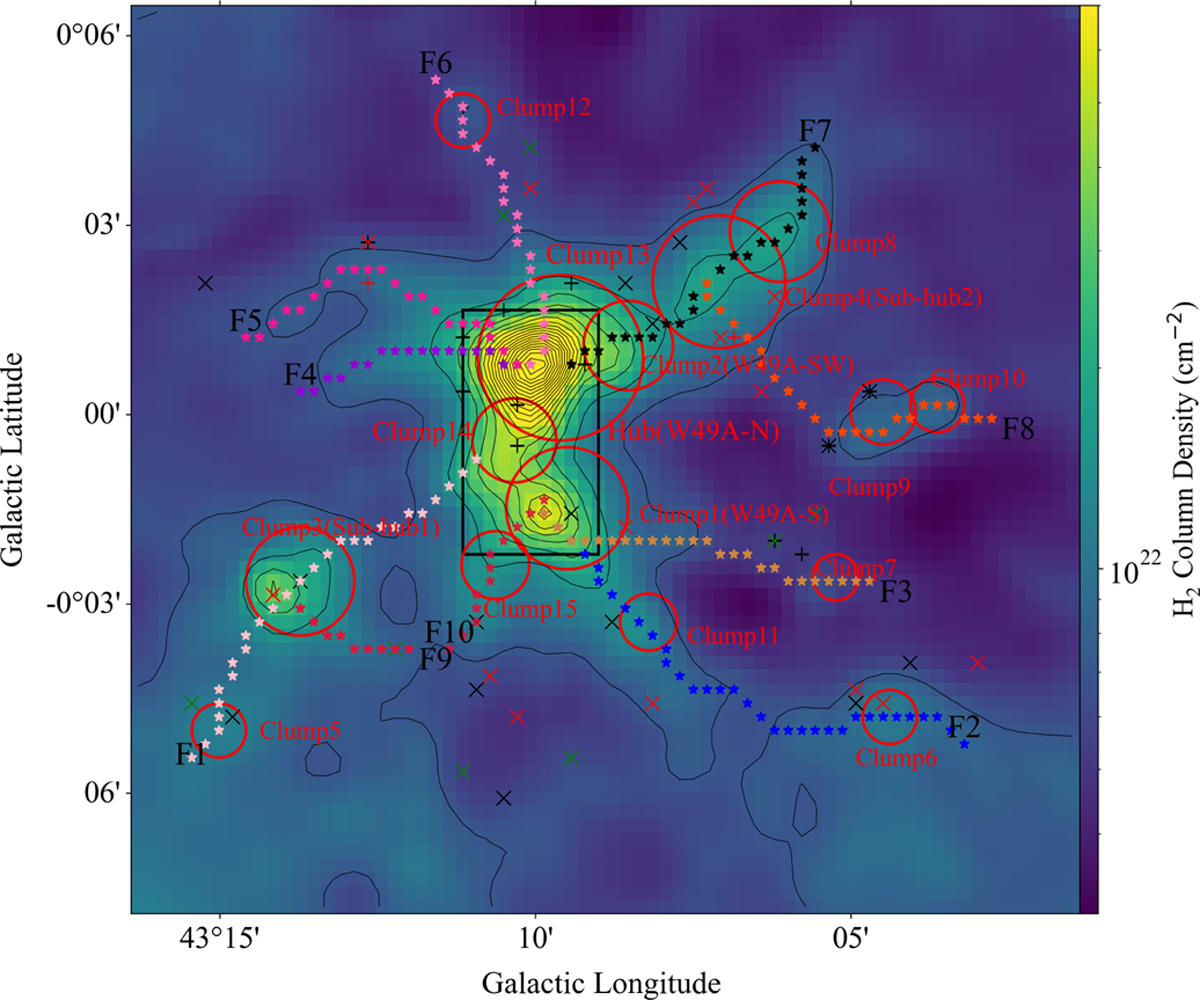
Filament structures of the W49A region. The color map is the distribution of the hydrogen molecular column density. The range of contours (from the outside in) is from 7.06 × 1021 cm−2 to 1.71 × 1023 cm−2. The star-like skeleton shows the filaments, and the circles and boxes represent W49A-N and the dense clumps from the catalog of Urquhart et al. (2014) and De Buizer et al. (2021). Plus signs in the figure represent the YSOs marked by Saral et al. (2015) in W49, and the cross signs denote YSOs reported by Kuhn et al. (2021). A black cross represents Class I YSO, a red cross is a Class II YSO, a green plus sign represents Class III YSOs, and a green cross sign is for a flat SED source.
Current usage metrics show cumulative count of Article Views (full-text article views including HTML views, PDF and ePub downloads, according to the available data) and Abstracts Views on Vision4Press platform.
Data correspond to usage on the plateform after 2015. The current usage metrics is available 48-96 hours after online publication and is updated daily on week days.
Initial download of the metrics may take a while.