Fig. 3
Download original image
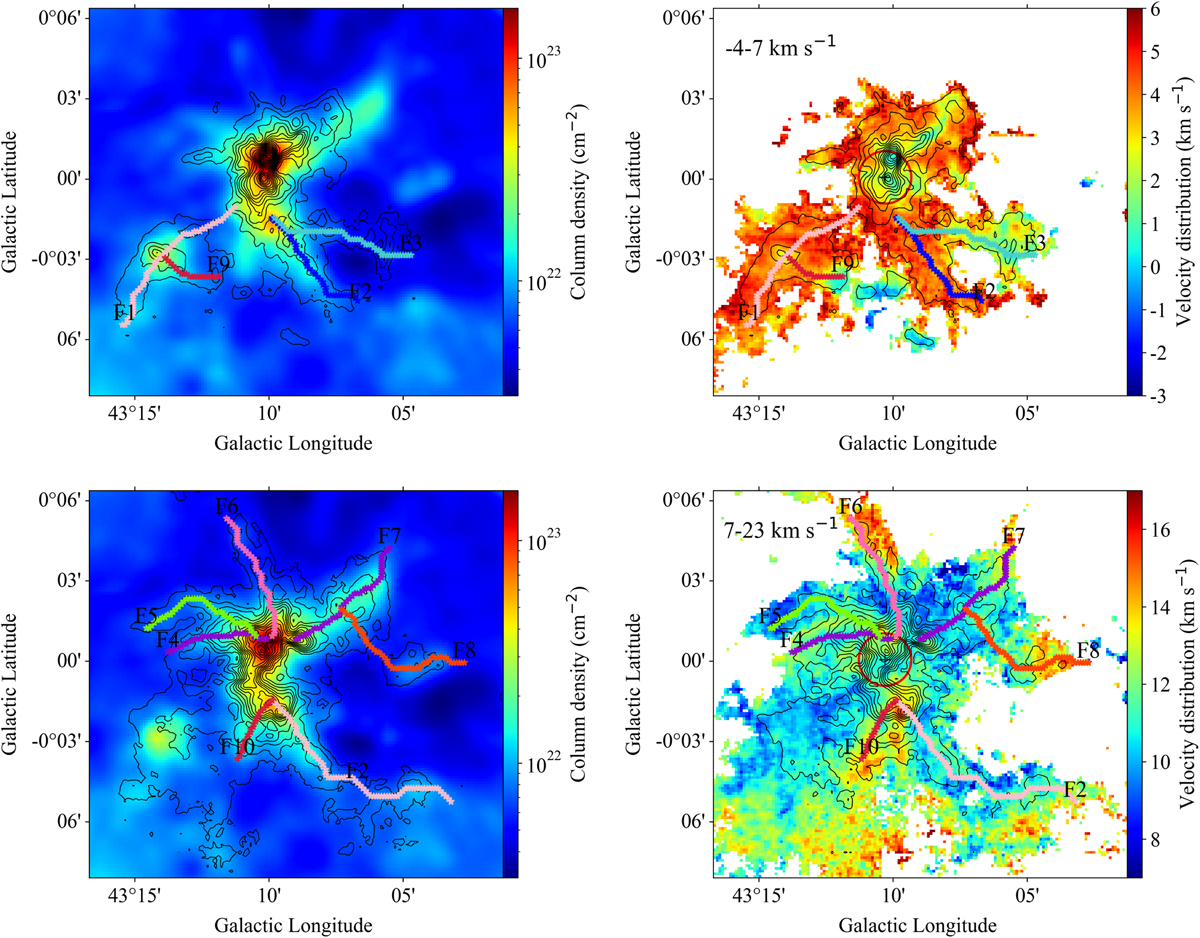
B-S and R-S HFSs in W49A. Left panels: heat map representing the hydrogen molecular column density overlaid with the integrated intensity contours of the R-S (bottom) and B-S (top) components of 12CO (3–2). The colored dots mark the skeletons of the filaments corresponding to the R-S (bottom) and B-S (top) components. Right panels: heat map representing the velocity distribution of the R-S (bottom) and B-S (top) components of 12CO (3–2), overlaid with contours of the integrated intensity of the R-S (bottom) and B-S (top) components. The masked area is where the integrated intensity is less than ten times that of the image rms. The red circle indicates the shell of the H II region in W49A-N with the radius of ~3.3 pc, and the black cross indicates the central location (Peng et al. 2010).
Current usage metrics show cumulative count of Article Views (full-text article views including HTML views, PDF and ePub downloads, according to the available data) and Abstracts Views on Vision4Press platform.
Data correspond to usage on the plateform after 2015. The current usage metrics is available 48-96 hours after online publication and is updated daily on week days.
Initial download of the metrics may take a while.