Fig. 5
Download original image
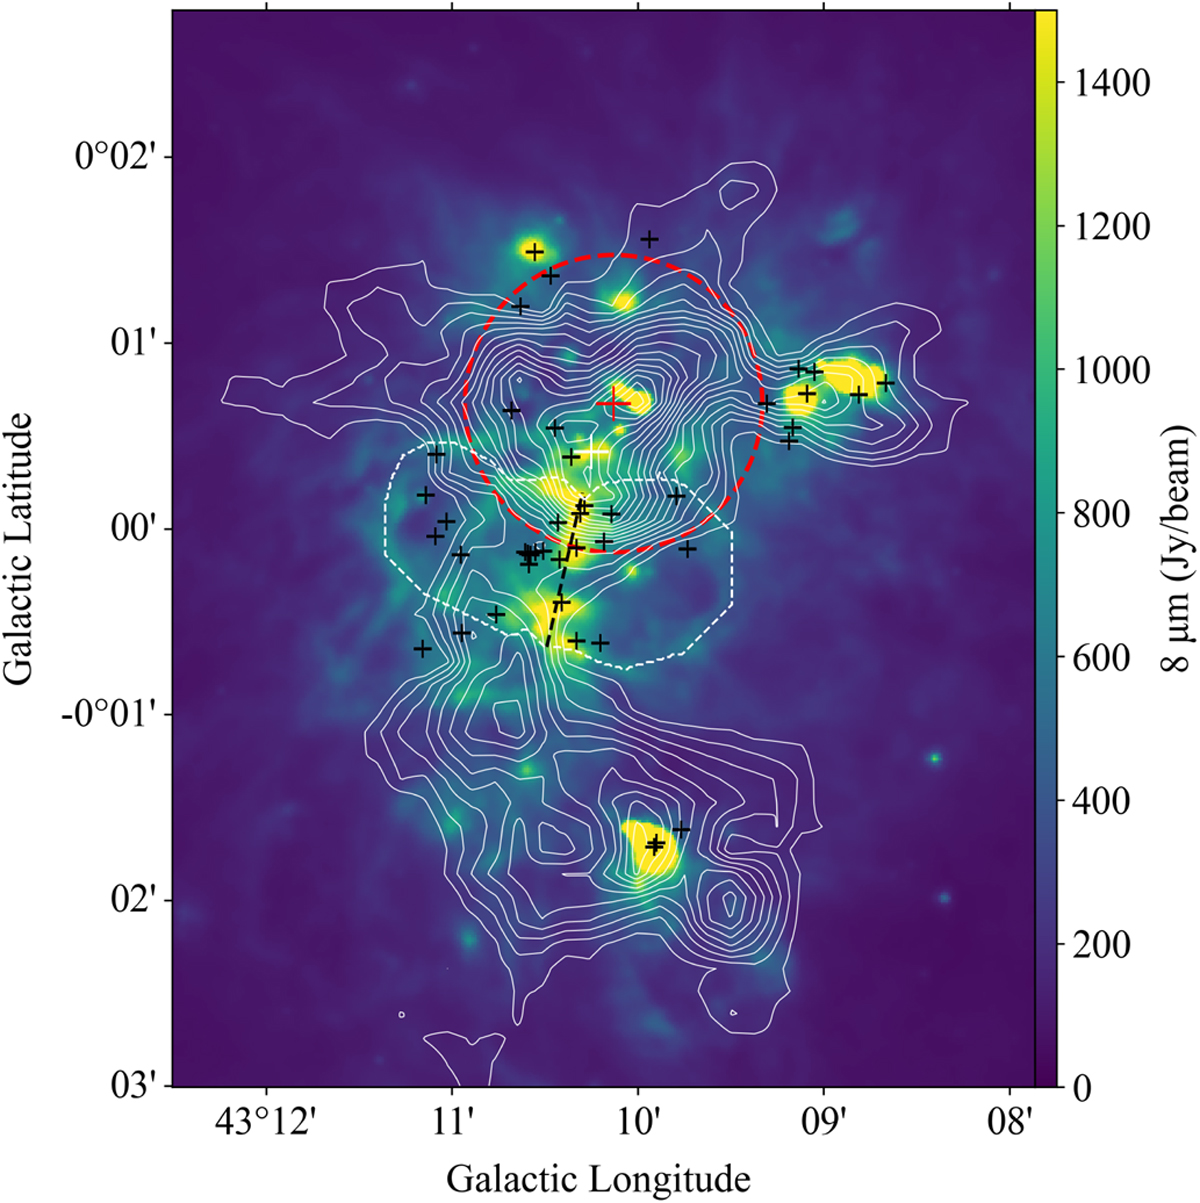
Color map 8 μm continuum superposed on the white contours of the 13CO (3–2) integrated intensity of the R-S HFS. The red circles mark the collision of two dense components, as identified by Miyawaki et al. (2022). The black plus signs indicate the distribution of massive stars in W49 confirmed by Wu et al. (2016). The dotted black line denotes the waist of the bipolar bubble, and the white plus sign is where the 1420 MHz continuum radiation is strongest. The dashed white lines mark the outline of the bipolar bubble.
Current usage metrics show cumulative count of Article Views (full-text article views including HTML views, PDF and ePub downloads, according to the available data) and Abstracts Views on Vision4Press platform.
Data correspond to usage on the plateform after 2015. The current usage metrics is available 48-96 hours after online publication and is updated daily on week days.
Initial download of the metrics may take a while.