Fig. 7
Download original image
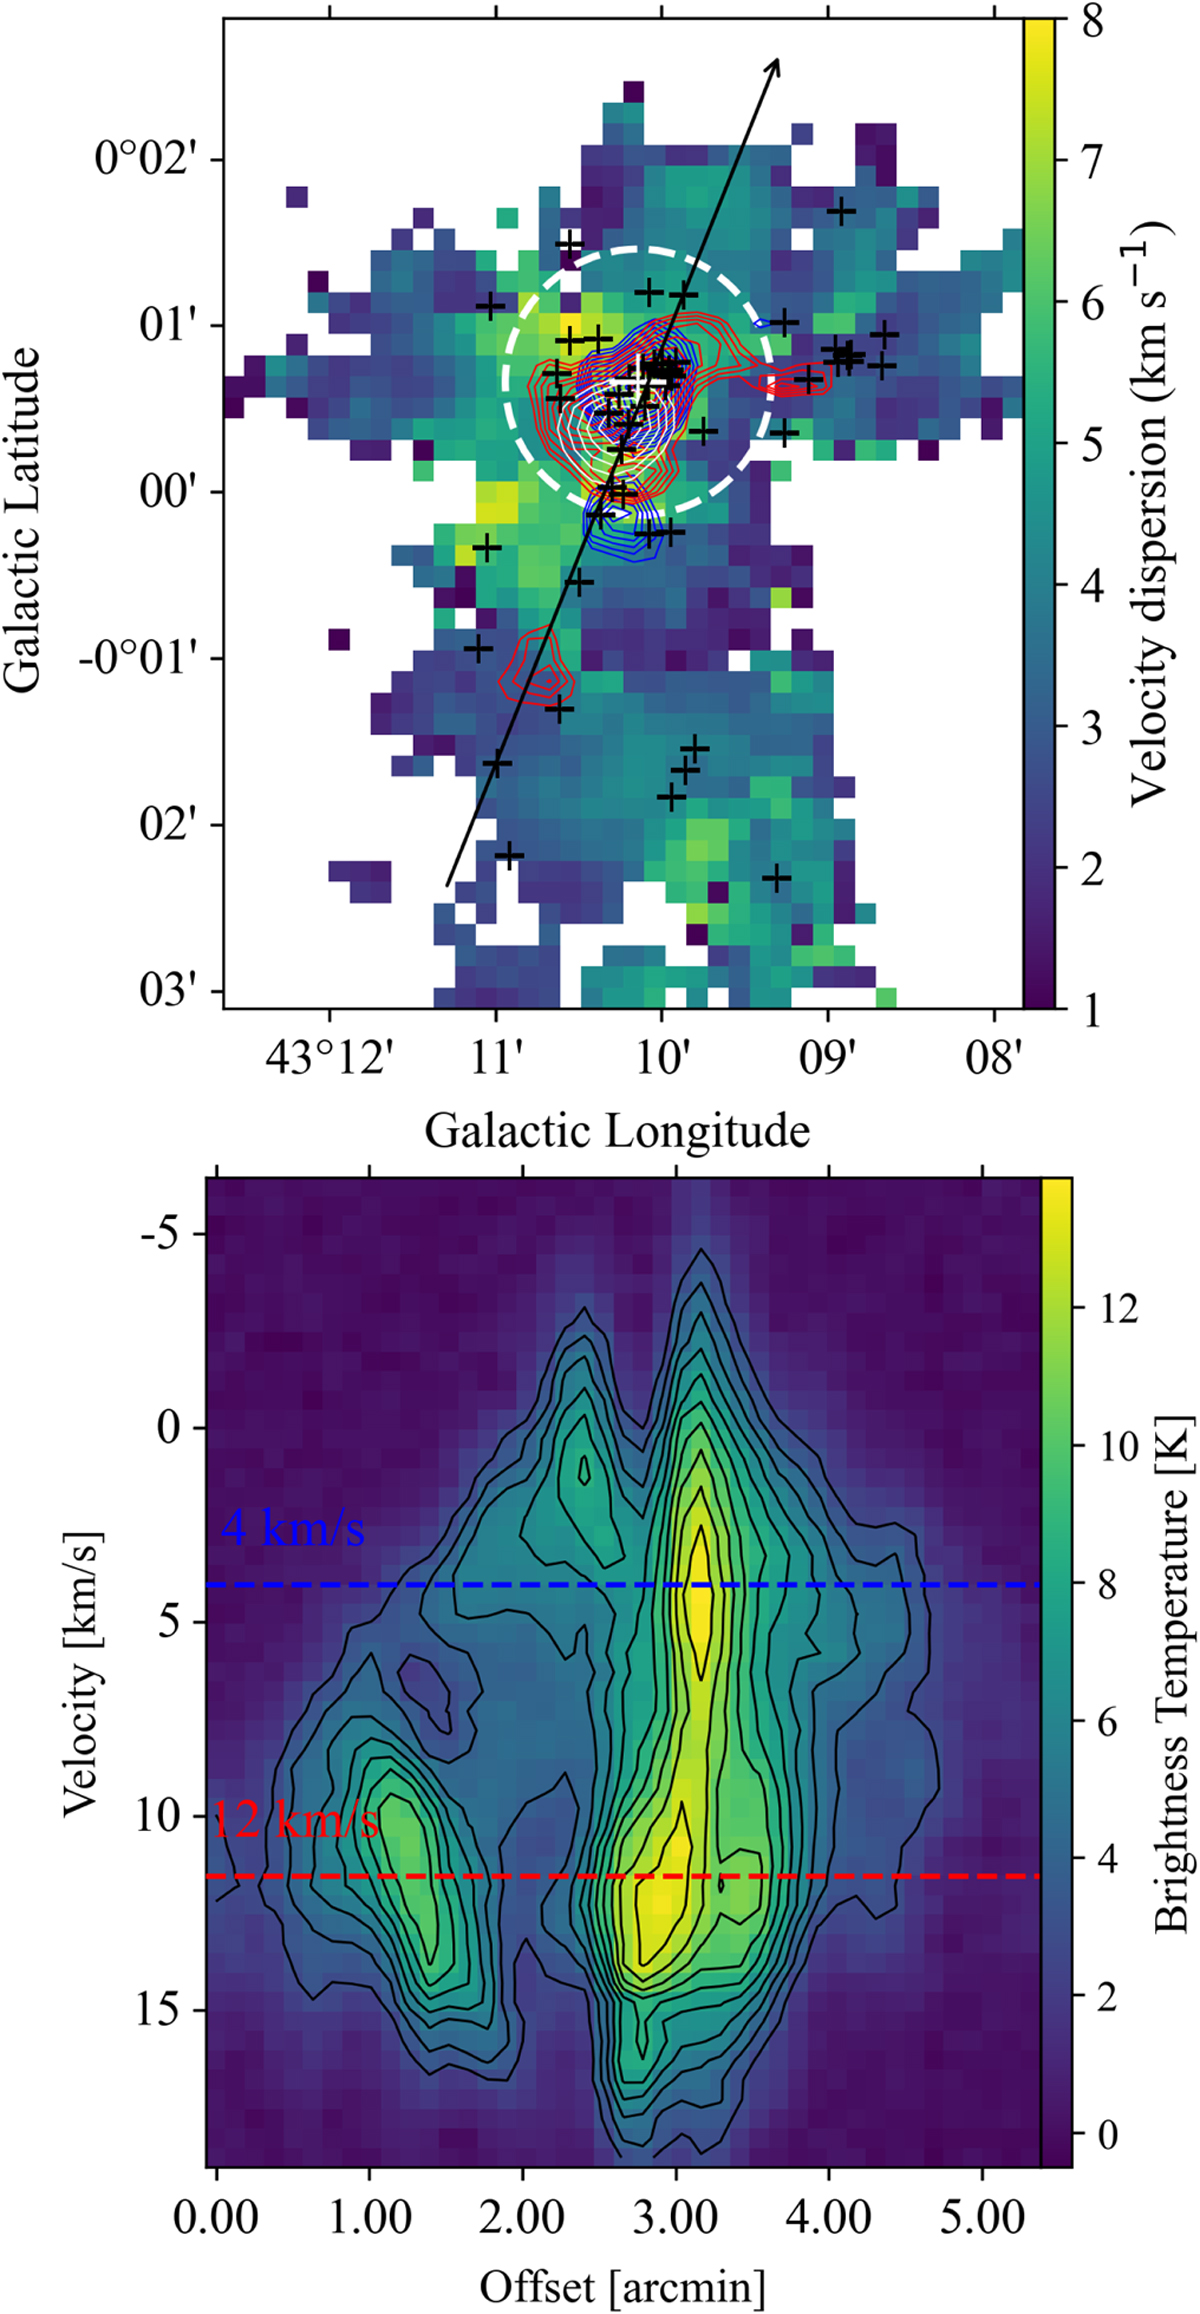
Velocity dispersion and P-V diagram of W49A-N. Top panel: velocity dispersion of 13CO (3–2), shown with the color map, and the velocity contours of −1–4 km s−1 and 9–14 km s−1, shown as blue and red contours, respectively. The white contours represent the strongest positions of the 1420 MHz continuum radiation (the outermost contour corresponds to 60% of the peak intensity). The plus sign indicates the massive YSO reported by De Buizer et al. (2021). The white circle is the position of the collision pointed out by Miyawaki et al. (2022). Bottom panel: P-V diagram along the direction of the black arrow in the top panel.
Current usage metrics show cumulative count of Article Views (full-text article views including HTML views, PDF and ePub downloads, according to the available data) and Abstracts Views on Vision4Press platform.
Data correspond to usage on the plateform after 2015. The current usage metrics is available 48-96 hours after online publication and is updated daily on week days.
Initial download of the metrics may take a while.