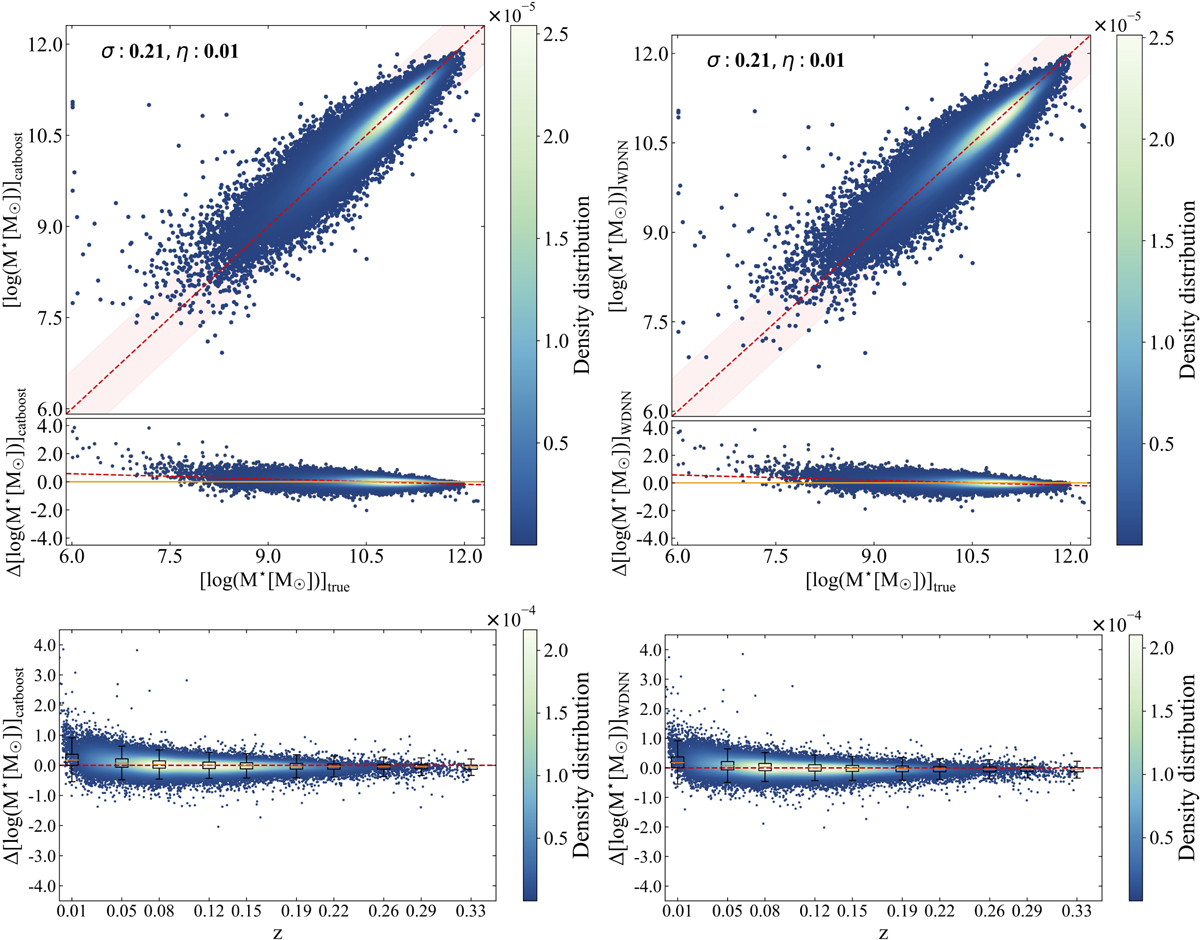
Fig. 6
Download original image
Results of CatBoost (left panels) and WDNN (right panels) on the test sample (20% of the entire dataset). The upper row subplots present a comparison of SM estimates from the ML model with SM values obtained from the SDSS MPA-JHU DR8 catalogue. Errors in the results obtained by the ML models about the true values are displayed at the bottom of the subplots. The pink-shaded region indicates a 3σ scatter of the SM errors, with any data point falling outside these limits considered an outlier. In the bottom row, box plots illustrate errors across redshift values. In the residual plots, the dashed lines illustrate the best fit through the scatter plots.
Current usage metrics show cumulative count of Article Views (full-text article views including HTML views, PDF and ePub downloads, according to the available data) and Abstracts Views on Vision4Press platform.
Data correspond to usage on the plateform after 2015. The current usage metrics is available 48-96 hours after online publication and is updated daily on week days.
Initial download of the metrics may take a while.