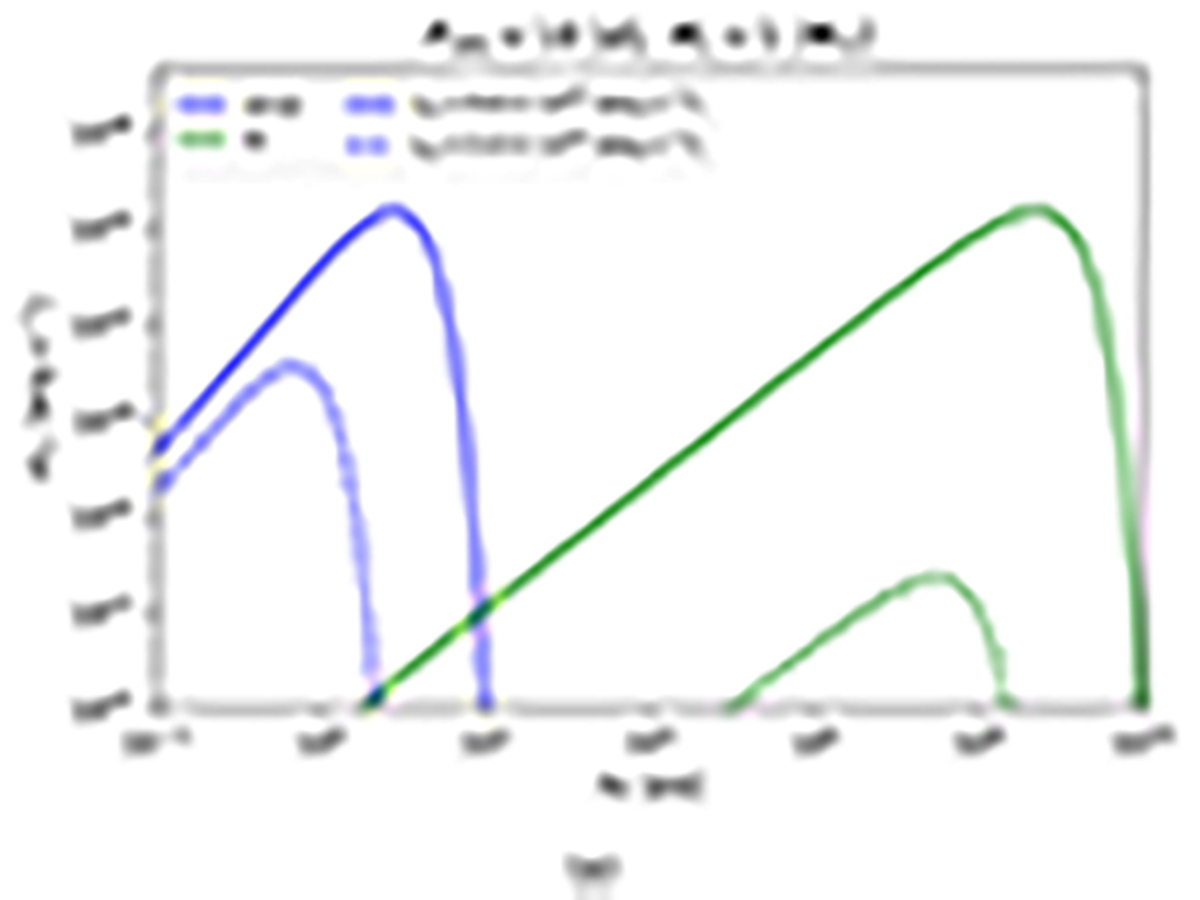
Fig. B.1.
Download original image
Spectra of the persistent preburst radiation for Case I involving the IC process with Tage = 102 yr corresponding to Lw ≃ 5.0 × 1036 erg s−1 (the dashed line) and Tage = 0 yr corresponding to Lw ≃ 9.6 × 1044 erg s−1 (the solid line). We set Porb = 10 day, corresponding to a ≈ 3.9 × 1011 cm and Mc = 1 M⊙. The blue lines show the preburst radiation spectrum of Case I. The green line indicates the IC spectrum. The corresponding parameters we used are p = 2.2, γm = 104, and γM = 106.
Current usage metrics show cumulative count of Article Views (full-text article views including HTML views, PDF and ePub downloads, according to the available data) and Abstracts Views on Vision4Press platform.
Data correspond to usage on the plateform after 2015. The current usage metrics is available 48-96 hours after online publication and is updated daily on week days.
Initial download of the metrics may take a while.