Fig. 24
Download original image
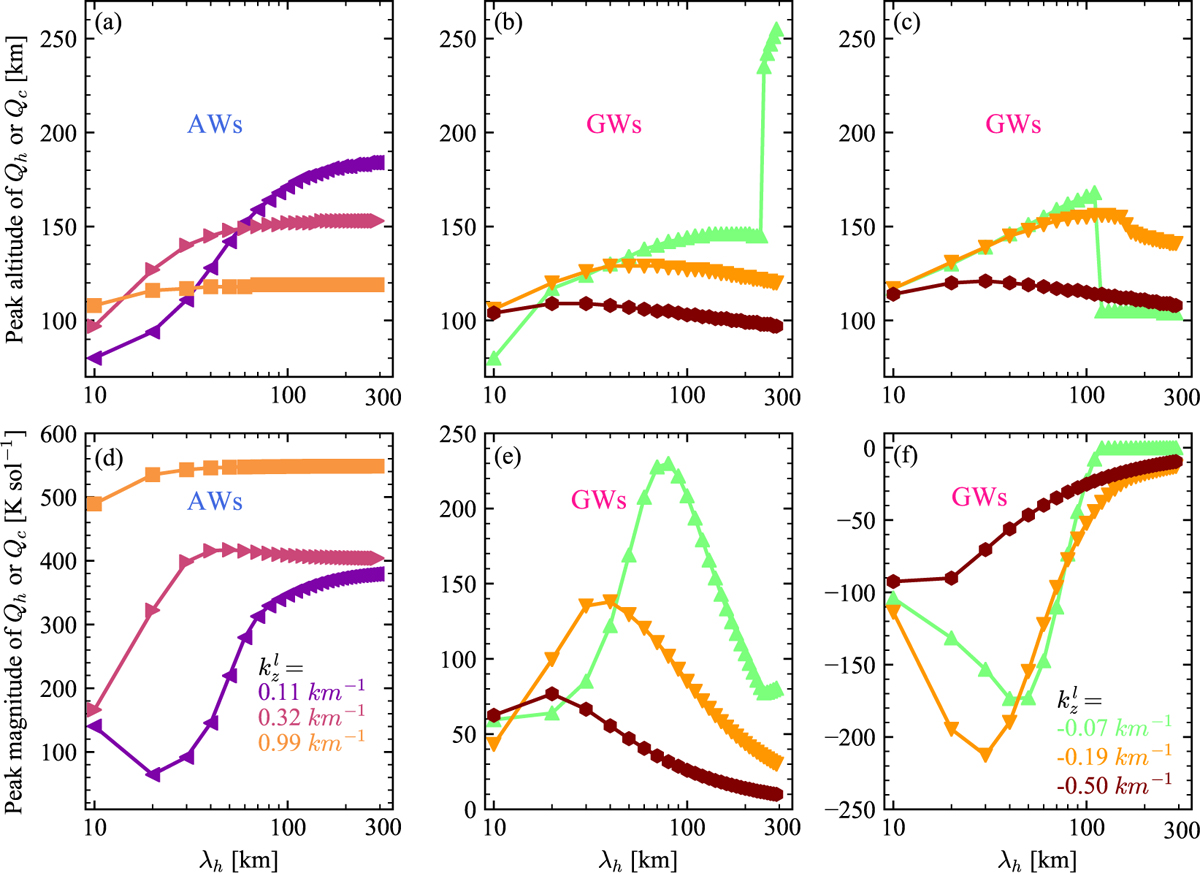
Distributions of the peak altitude and peak magnitude of wave heating rate (Qh) driven by selected acoustic/gravity wave sets and displayed in panels a/b and d/e, respectively. Panels c and f illustrate peak altitude and peak magnitude of wave cooling rate (Qc) induced by the selected gravity wave branches, respectively. “AWs” and “GWs” represent the selected acoustic wave branches and gravity wave branches, respectively. ![]() equals 0.11, 0.32, and 0.99 km−1 for AWs and −0.07, −0.19, −0.5 km−1 for GWs. Horizontal wavelengths of the selected wave modes range from 10 km to 300 km in intervals of 10 km.
equals 0.11, 0.32, and 0.99 km−1 for AWs and −0.07, −0.19, −0.5 km−1 for GWs. Horizontal wavelengths of the selected wave modes range from 10 km to 300 km in intervals of 10 km.
Current usage metrics show cumulative count of Article Views (full-text article views including HTML views, PDF and ePub downloads, according to the available data) and Abstracts Views on Vision4Press platform.
Data correspond to usage on the plateform after 2015. The current usage metrics is available 48-96 hours after online publication and is updated daily on week days.
Initial download of the metrics may take a while.