Open Access
Fig. 2.
Download original image
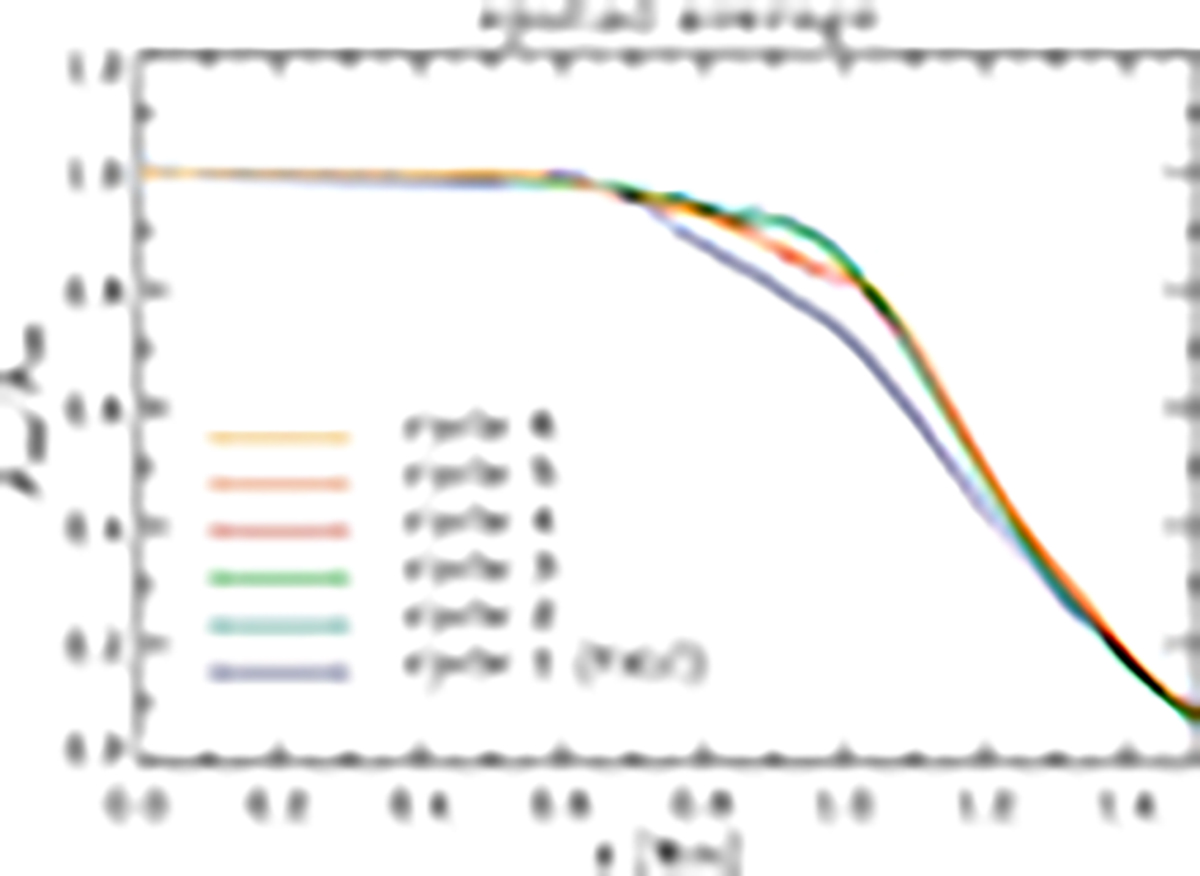
Vertical z stratification of spatial (x, y) average of ratio between the upper level, βupp, and lower level, βlow, departure coefficients. Color-codes indicate the values after each inversion cycle. The initial cycle (dark blue) corresponds to the departure coefficients obtained from the VALC model.
Current usage metrics show cumulative count of Article Views (full-text article views including HTML views, PDF and ePub downloads, according to the available data) and Abstracts Views on Vision4Press platform.
Data correspond to usage on the plateform after 2015. The current usage metrics is available 48-96 hours after online publication and is updated daily on week days.
Initial download of the metrics may take a while.