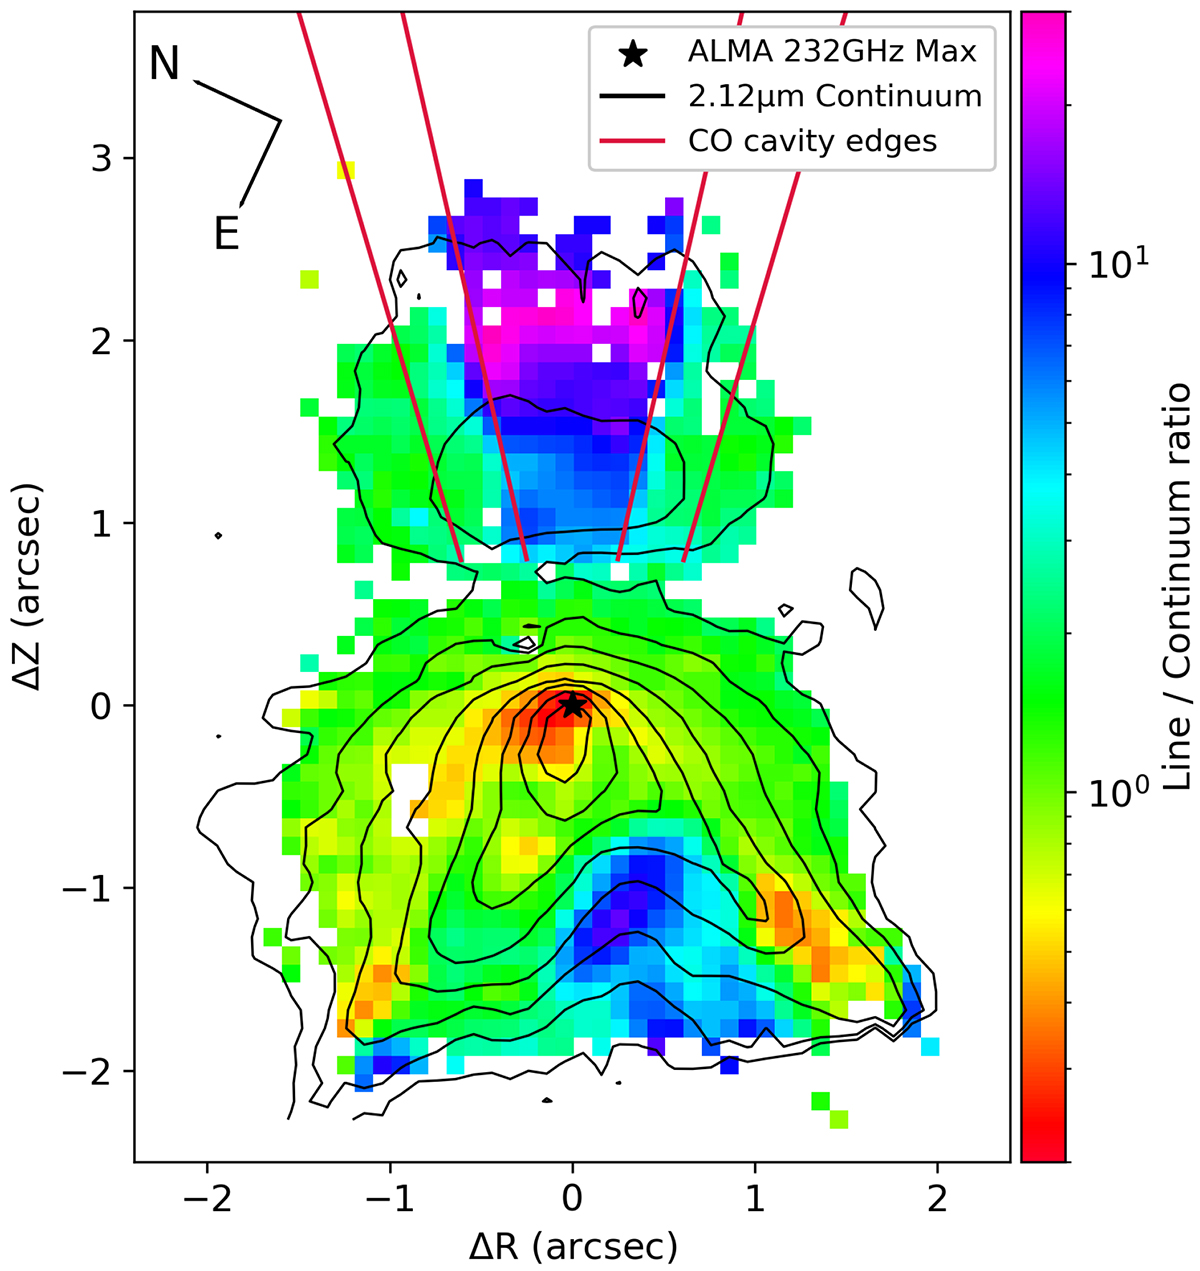
Fig. 5.
Download original image
NIRSpec H2 line to continuum map. The color map shows the flux ratio between the 1−0 S(1) H2 line and the local continuum. The ratio is computed for a S/N > 3 in both line and continuum. Black contours plot the continuum map. Levels start at 4σ (with σ = 1.4 × 10⁻³ erg s−1 cm−2 μm−1 sr−1) and increase by a factor of 2. Solid red lines show the projected inner and outer limits of the bright CO cone derived by DV22.
Current usage metrics show cumulative count of Article Views (full-text article views including HTML views, PDF and ePub downloads, according to the available data) and Abstracts Views on Vision4Press platform.
Data correspond to usage on the plateform after 2015. The current usage metrics is available 48-96 hours after online publication and is updated daily on week days.
Initial download of the metrics may take a while.