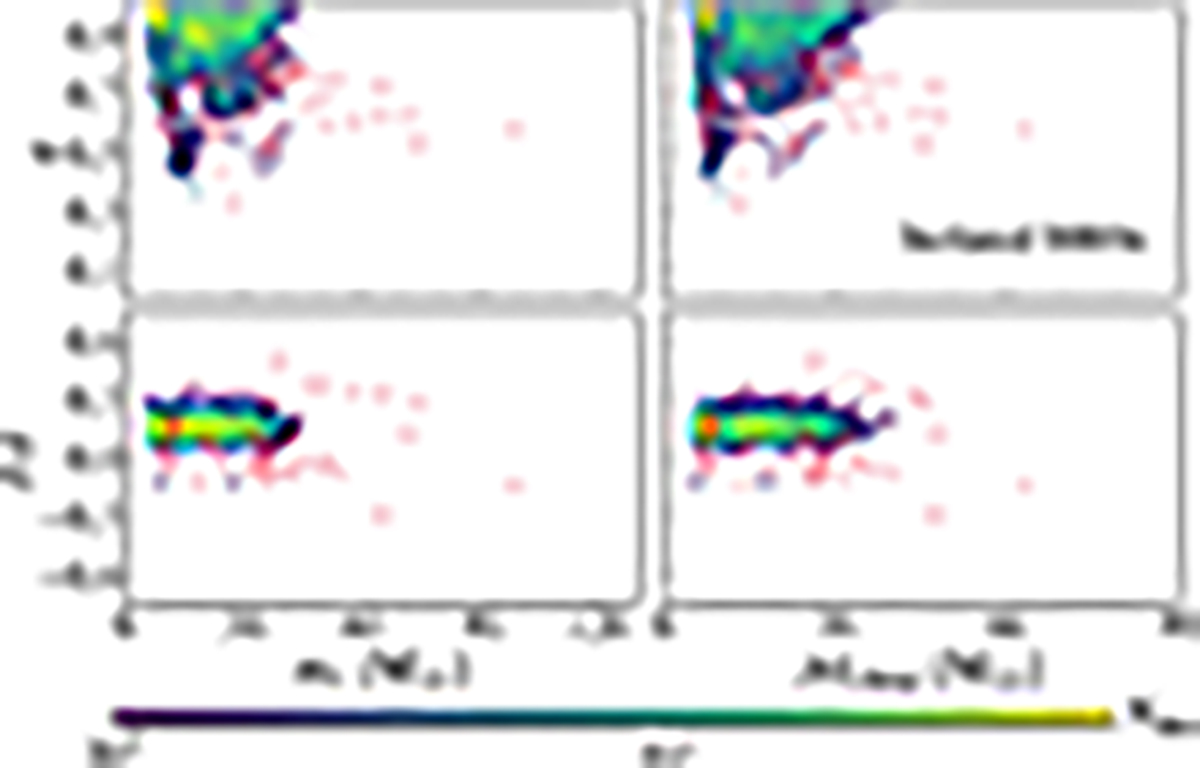
Fig. D.1.
Download original image
Two dimensional histograms of the detectable simulated BBHs in the isolated binary evolution model. The four panels show, from left to right and from top to bottom, q − m1, q − ℳchirp, χeff − m1, and χeff − ℳchirp. The red points are the data from Abbott et al. (2023b). We do not add error bars in order to avoid overcrowding the plot.
Current usage metrics show cumulative count of Article Views (full-text article views including HTML views, PDF and ePub downloads, according to the available data) and Abstracts Views on Vision4Press platform.
Data correspond to usage on the plateform after 2015. The current usage metrics is available 48-96 hours after online publication and is updated daily on week days.
Initial download of the metrics may take a while.