Fig. 4.
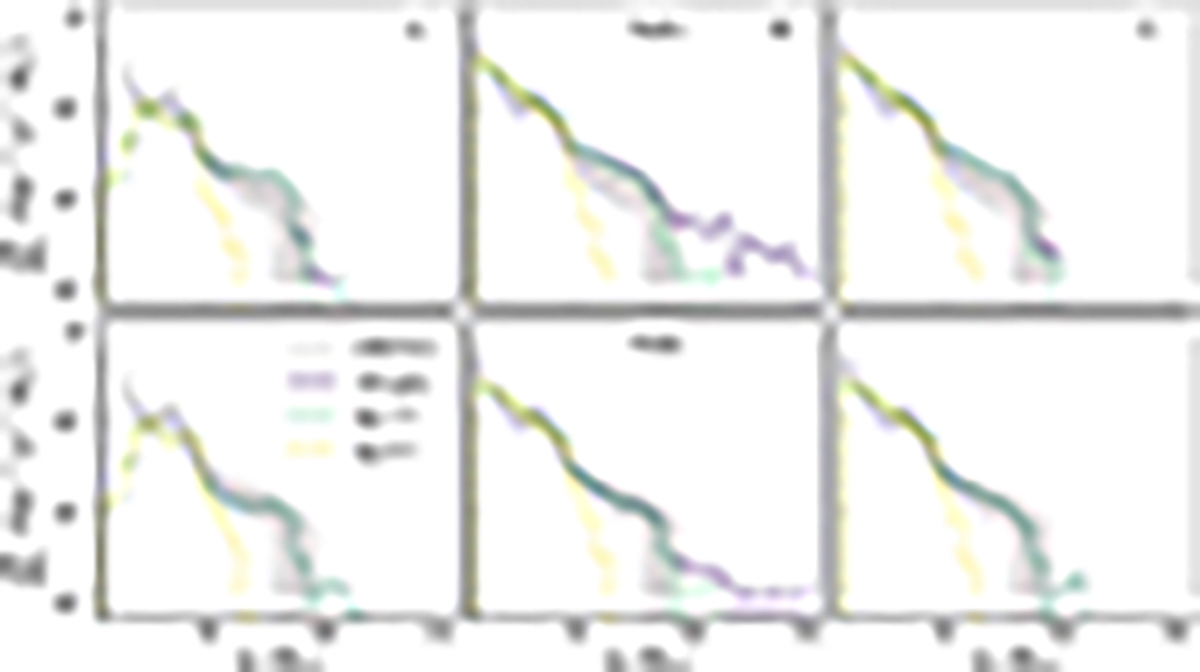
Download original image
Primary BH mass differential merger rate density in the Local Volume for models A (left), B (center), and C (right) for the NoEv (upper panels) and Tidal (lower panels) cases. We show the mass distribution resulting from 1g mergers (yellow dash-dotted line), 1g and 2g mergers (green dashed line), and from all BBH generations together (purple solid line). The black dashed line is the median value of the POWER LAW + PEAK model, as inferred from GWTC-3 (Abbott et al. 2023b). The gray shaded areas are the corresponding 90% credible intervals. In this and the following figures, the black line and shaded gray areas are shown only for a qualitative comparison, because our simulations do not assume the parametric models adopted by the LVK.
Current usage metrics show cumulative count of Article Views (full-text article views including HTML views, PDF and ePub downloads, according to the available data) and Abstracts Views on Vision4Press platform.
Data correspond to usage on the plateform after 2015. The current usage metrics is available 48-96 hours after online publication and is updated daily on week days.
Initial download of the metrics may take a while.