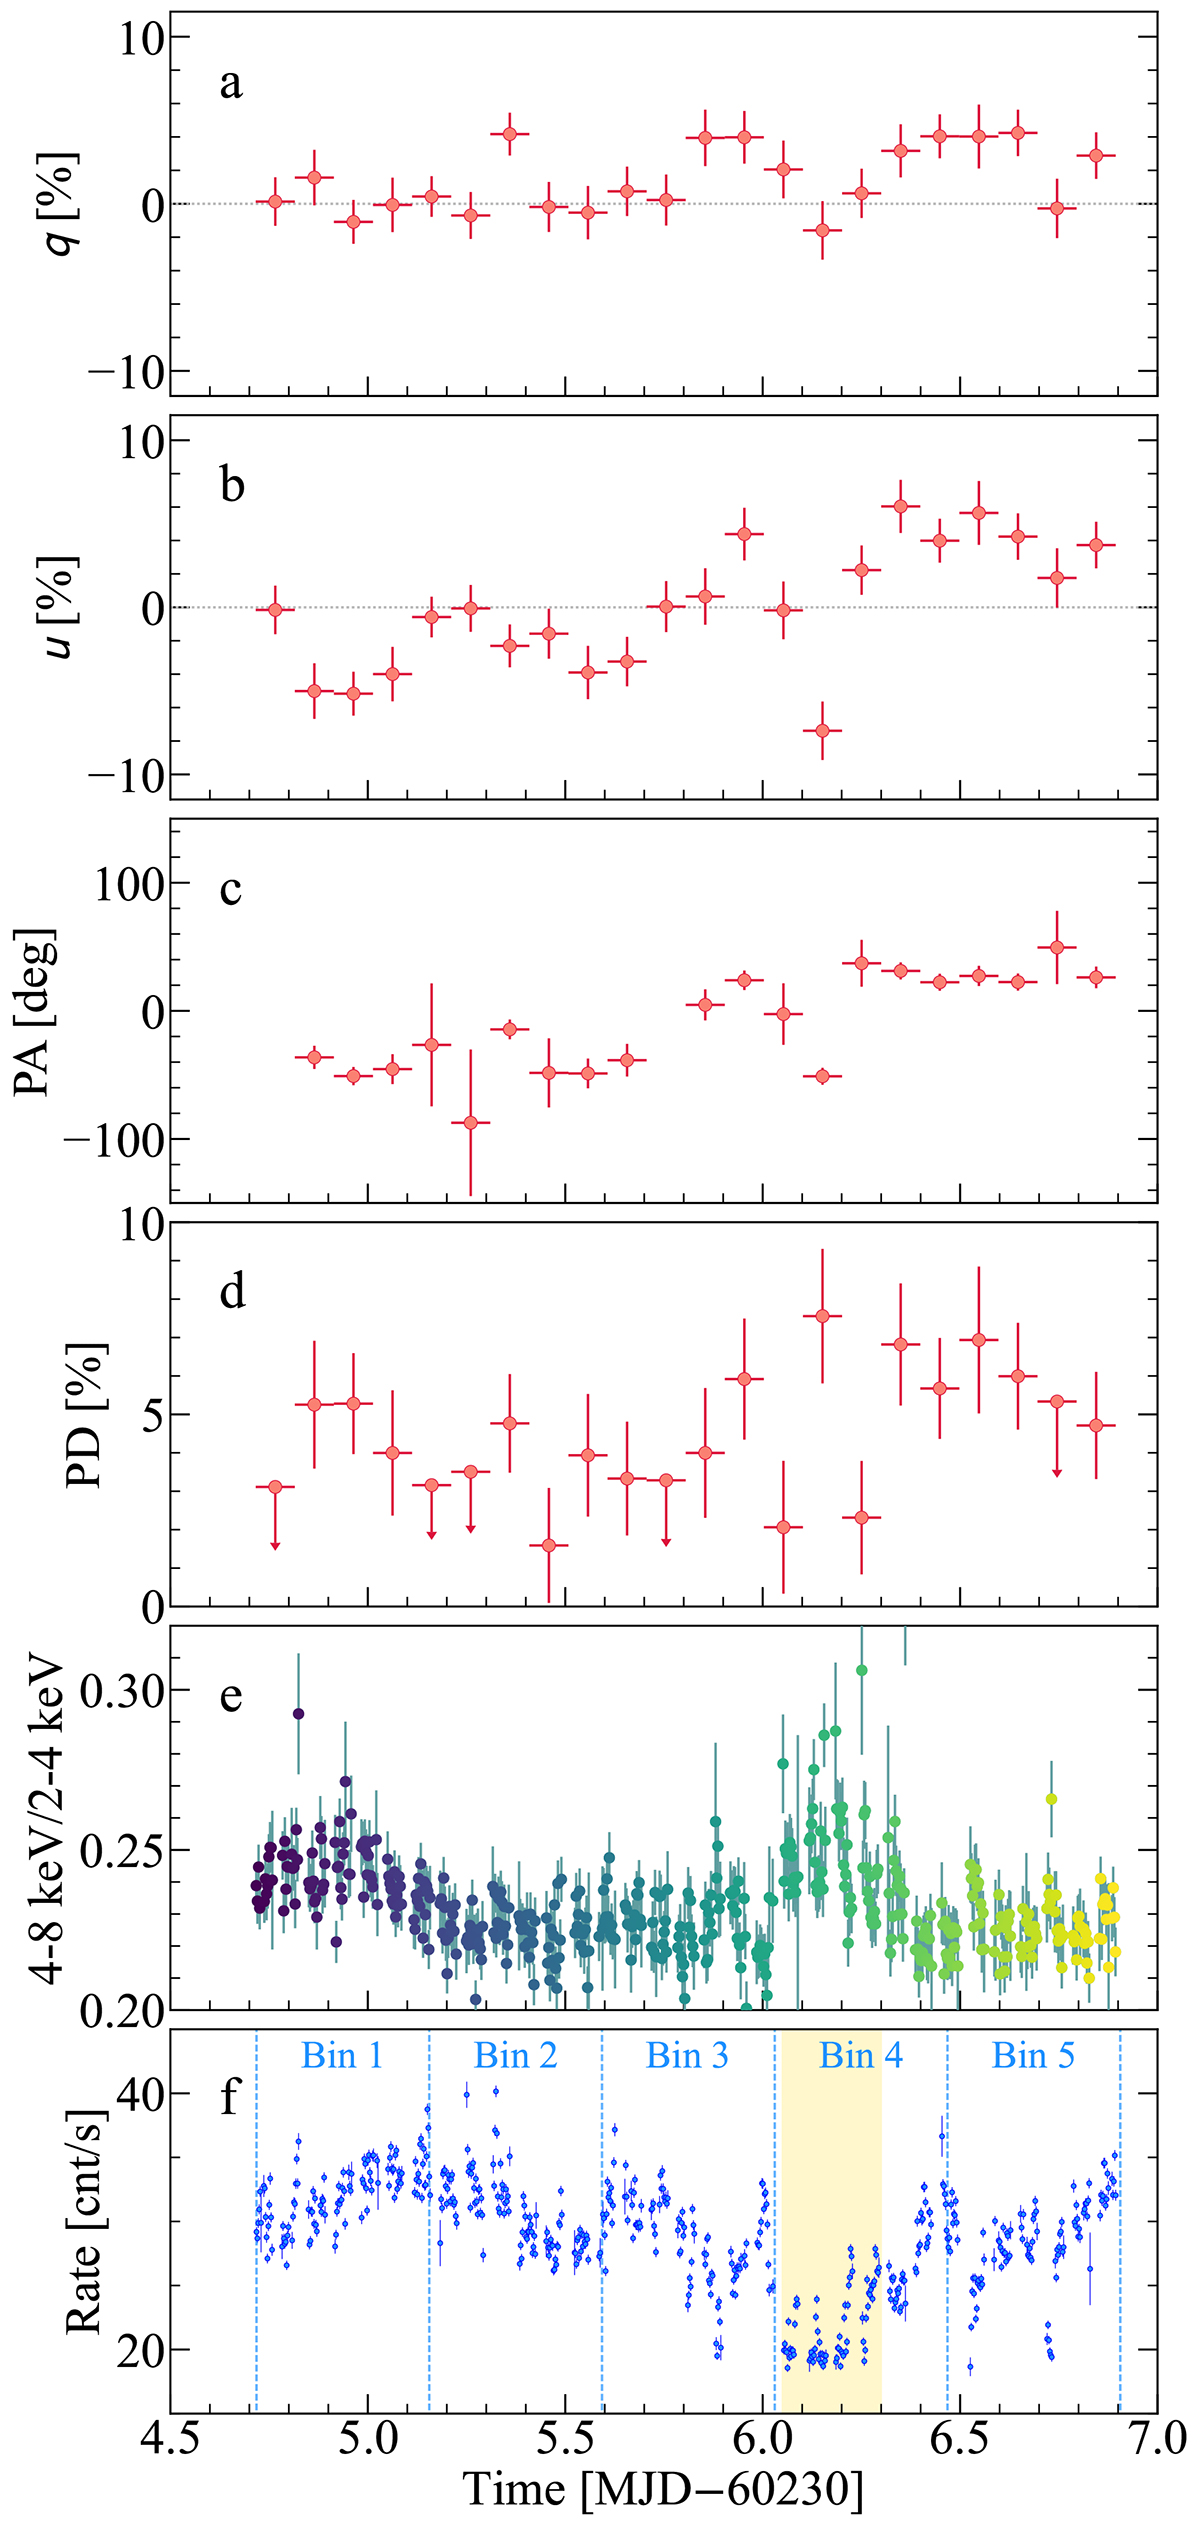
Fig. 1.
Download original image
Normalized Stokes q (a) and u (b) parameters, PA (c), PD (d), hardness ratio (e) with the same colors as in Fig. 2, and the count rate (f) as functions of time as observed by IXPE (all three detectors combined in the energy range 2–8 keV). The light curve is binned in ≈200 s. The dashed vertical blue lines separate the observation into five equal time bins of 10.5 h (Bins 1–5). The region highlighted in yellow corresponds to the dip in the light curve (see Sect. 3.1). Uncertainties are reported at the 68% CL.
Current usage metrics show cumulative count of Article Views (full-text article views including HTML views, PDF and ePub downloads, according to the available data) and Abstracts Views on Vision4Press platform.
Data correspond to usage on the plateform after 2015. The current usage metrics is available 48-96 hours after online publication and is updated daily on week days.
Initial download of the metrics may take a while.