Fig. 1.
Download original image
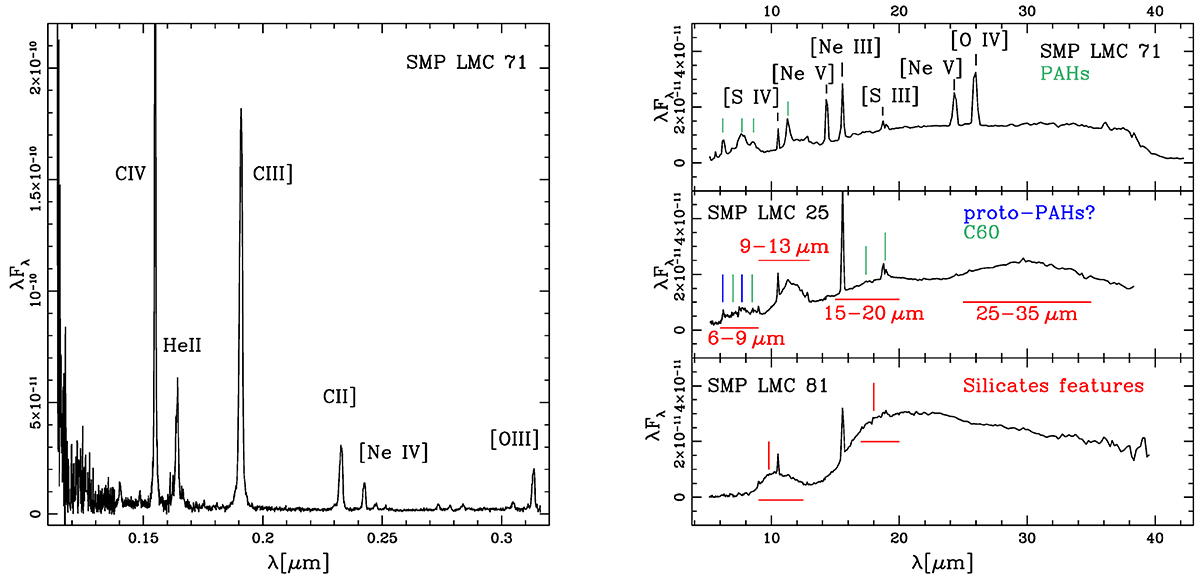
Atomic lines and dust features that mainly characterize the spectra of the PNe. Left: atomic lines in the HST/STIS spectrum of SMP LMC 71. Right: Mid-IR Spitzer/IRS spectra of SMP LMC 71 (top), SMP LMC 25 (middle), and SMP LMC 81 (bottom). The upper right panel shows the atomic nebular emission lines and the classical PAH features, while the middle and lower panels display the dust features typically observed in LMC CRD and ORD PNe, respectively.
Current usage metrics show cumulative count of Article Views (full-text article views including HTML views, PDF and ePub downloads, according to the available data) and Abstracts Views on Vision4Press platform.
Data correspond to usage on the plateform after 2015. The current usage metrics is available 48-96 hours after online publication and is updated daily on week days.
Initial download of the metrics may take a while.