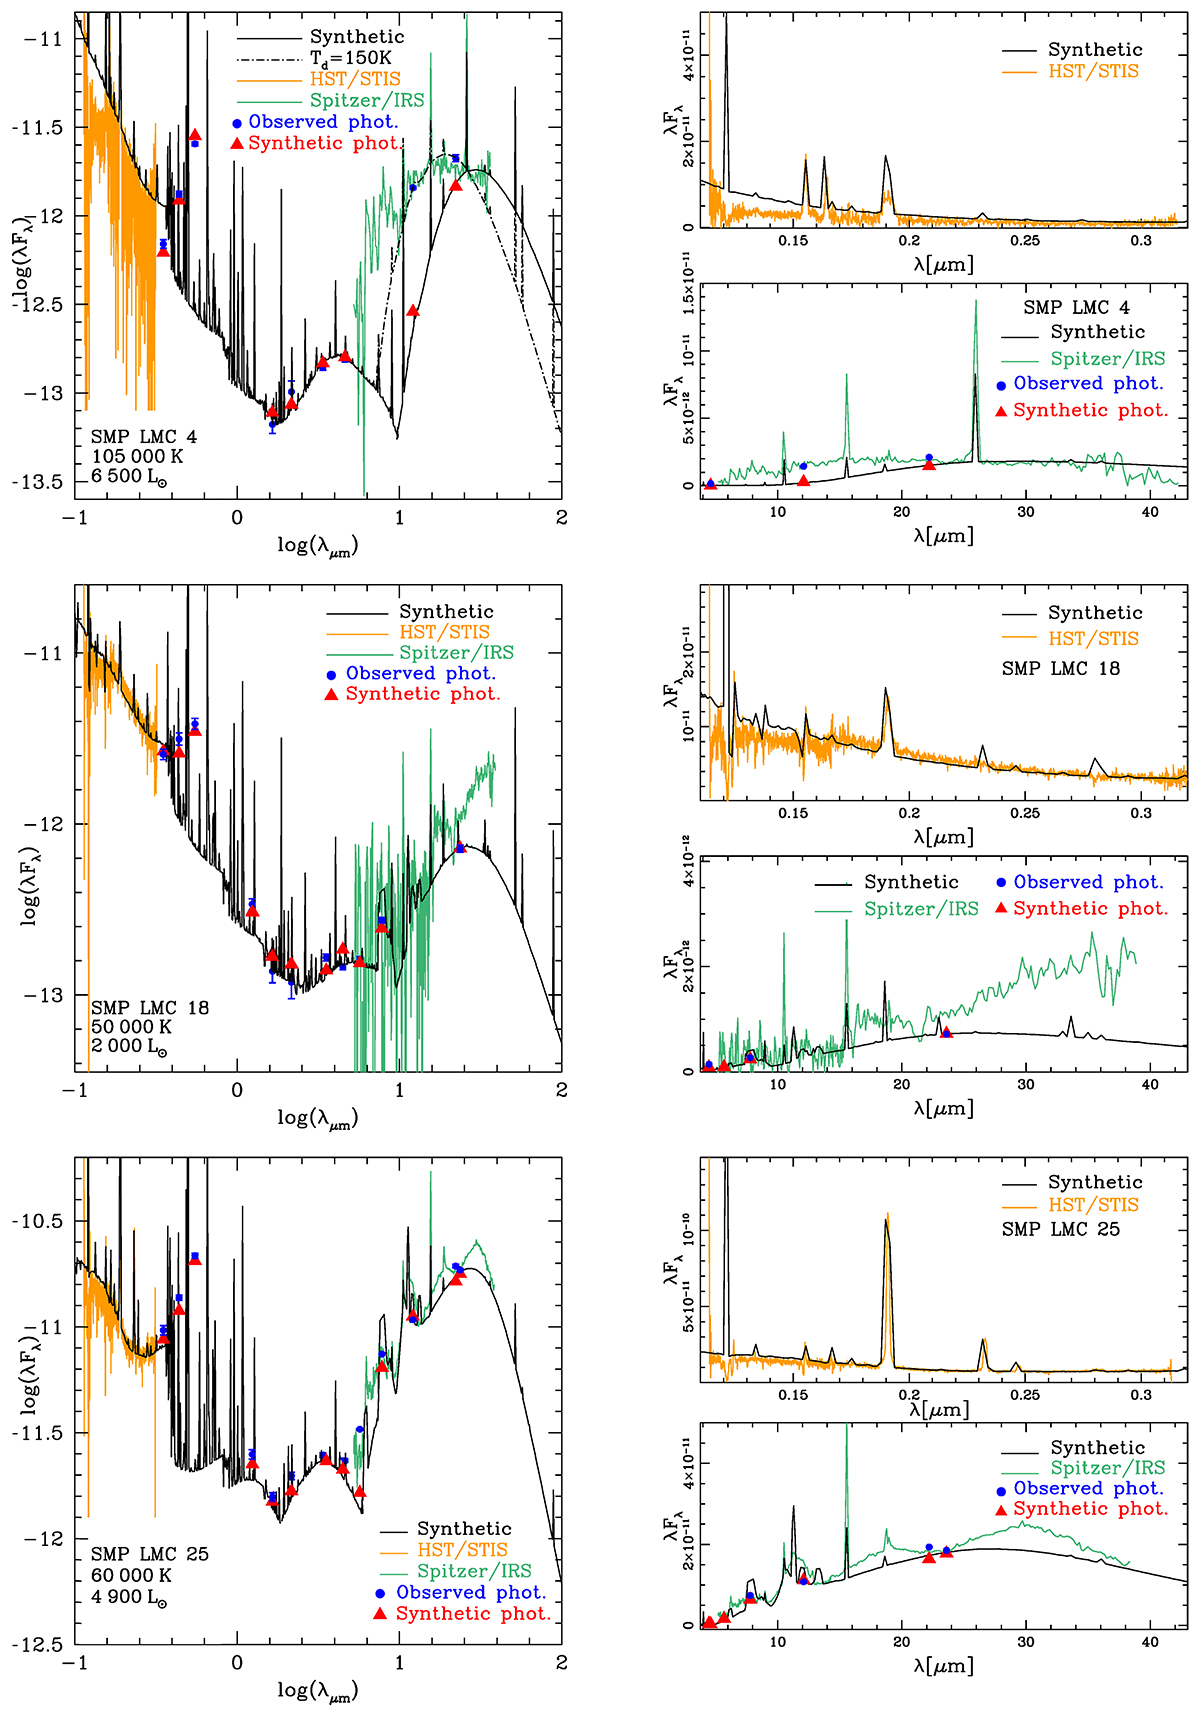
Fig. 2.
Download original image
SED of the CRD PNe, composed of the photometric data (blue dots) from Reid (2014), Cutri et al. (2012), and Lasker et al. (2008), the HST/STIS UV spectrum taken from (Stanghellini et al. 2005, in orange), and the Spitzer/IRS spectrum from (Stanghellini et al. 2007, in green). The black lines and red triangles indicate the synthetic spectra and photometry obtained in this work. The dotted line in the upper-left panel is the synthetic spectrum obtained by assuming a dust temperature of 150 K. In the right panels there are zoomed-in views of the UV (upper panel) and the IR spectra (lower panel).
Current usage metrics show cumulative count of Article Views (full-text article views including HTML views, PDF and ePub downloads, according to the available data) and Abstracts Views on Vision4Press platform.
Data correspond to usage on the plateform after 2015. The current usage metrics is available 48-96 hours after online publication and is updated daily on week days.
Initial download of the metrics may take a while.