Open Access
Fig. 6.
Download original image
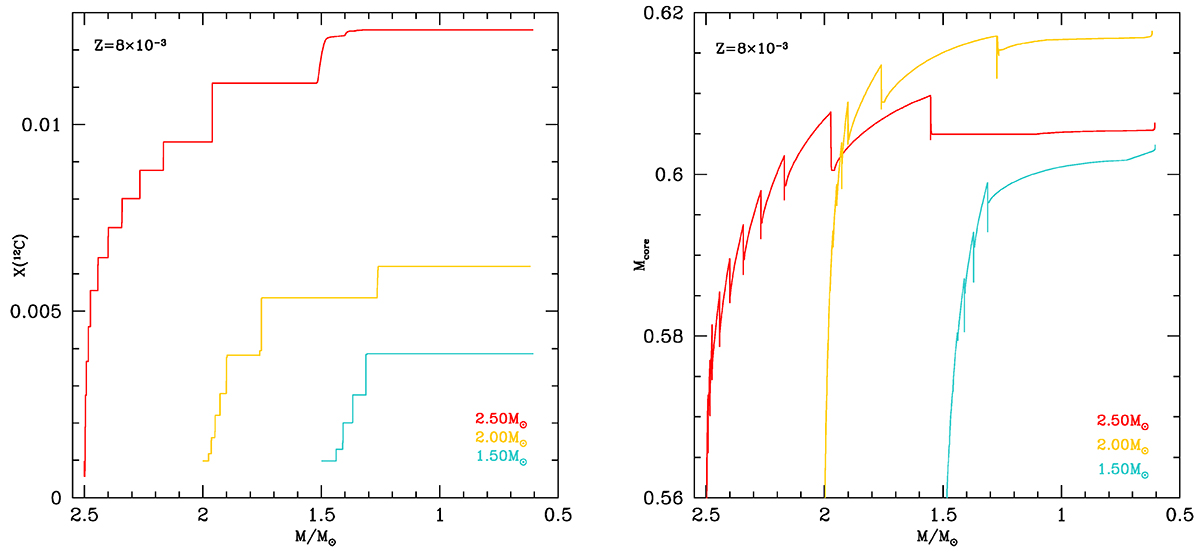
Evolution of stellar parameters as a function of the of the actual mass of the CS, for three models at Z = 8 × 10⁻³. Left: surface carbon mass fraction for the 2.5 M⊙ model (red), 2.0 M⊙ (yellow), and 1.5 M⊙ (cyan). Right: core mass variation for the same models reported in the left panel.
Current usage metrics show cumulative count of Article Views (full-text article views including HTML views, PDF and ePub downloads, according to the available data) and Abstracts Views on Vision4Press platform.
Data correspond to usage on the plateform after 2015. The current usage metrics is available 48-96 hours after online publication and is updated daily on week days.
Initial download of the metrics may take a while.