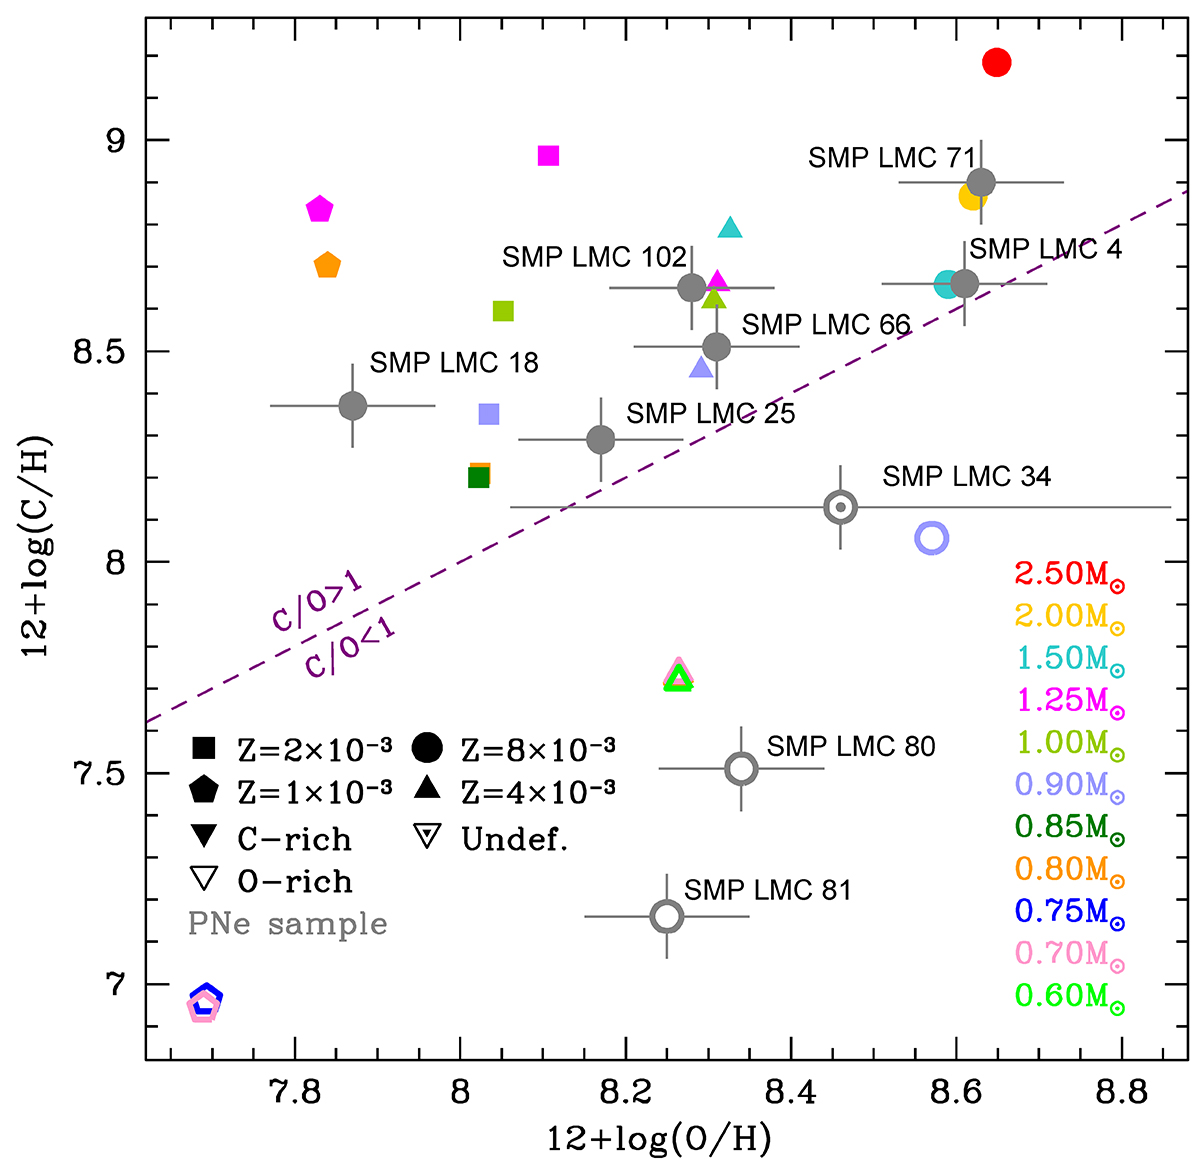
Fig. 7.
Download original image
Comparison of the abundances of carbon and oxygen observed for the PN sample (gray circles) and those computed using the ATON code at the end of the AGB evolution (colored symbols). Different shapes of the model represent different metallicities. Full and open symbols refer to the C/O ratio greater and lower than unity, respectively. The C/O of SMP LMC 34 is undefined due to the large oxygen error bar. The dashed line separates the oxygen-rich sources from the carbon-rich ones.
Current usage metrics show cumulative count of Article Views (full-text article views including HTML views, PDF and ePub downloads, according to the available data) and Abstracts Views on Vision4Press platform.
Data correspond to usage on the plateform after 2015. The current usage metrics is available 48-96 hours after online publication and is updated daily on week days.
Initial download of the metrics may take a while.