Open Access
Fig. 1.
Download original image
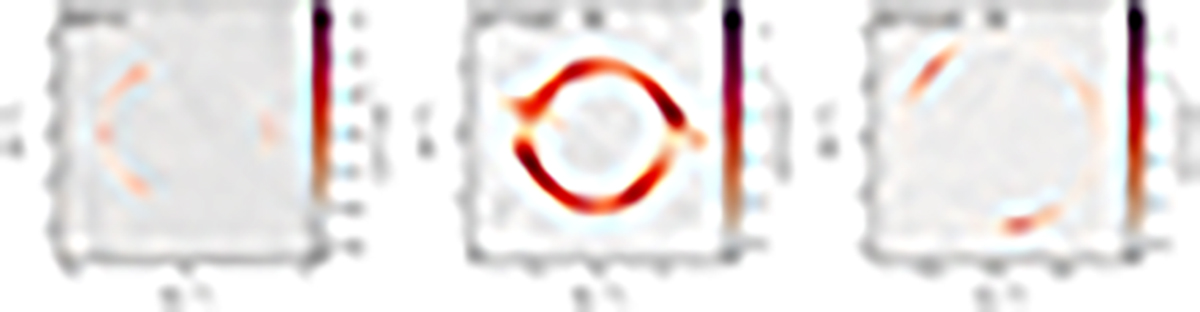
Deconvolved images using natural weighting of the visibilities. The synthesised beam is shown by the black ellipse in the bottom left corner of each panel and the sizes are given in Table 1. These images are only for visualisation as the lens modelling was done with respect to the visibility data directly.
Current usage metrics show cumulative count of Article Views (full-text article views including HTML views, PDF and ePub downloads, according to the available data) and Abstracts Views on Vision4Press platform.
Data correspond to usage on the plateform after 2015. The current usage metrics is available 48-96 hours after online publication and is updated daily on week days.
Initial download of the metrics may take a while.