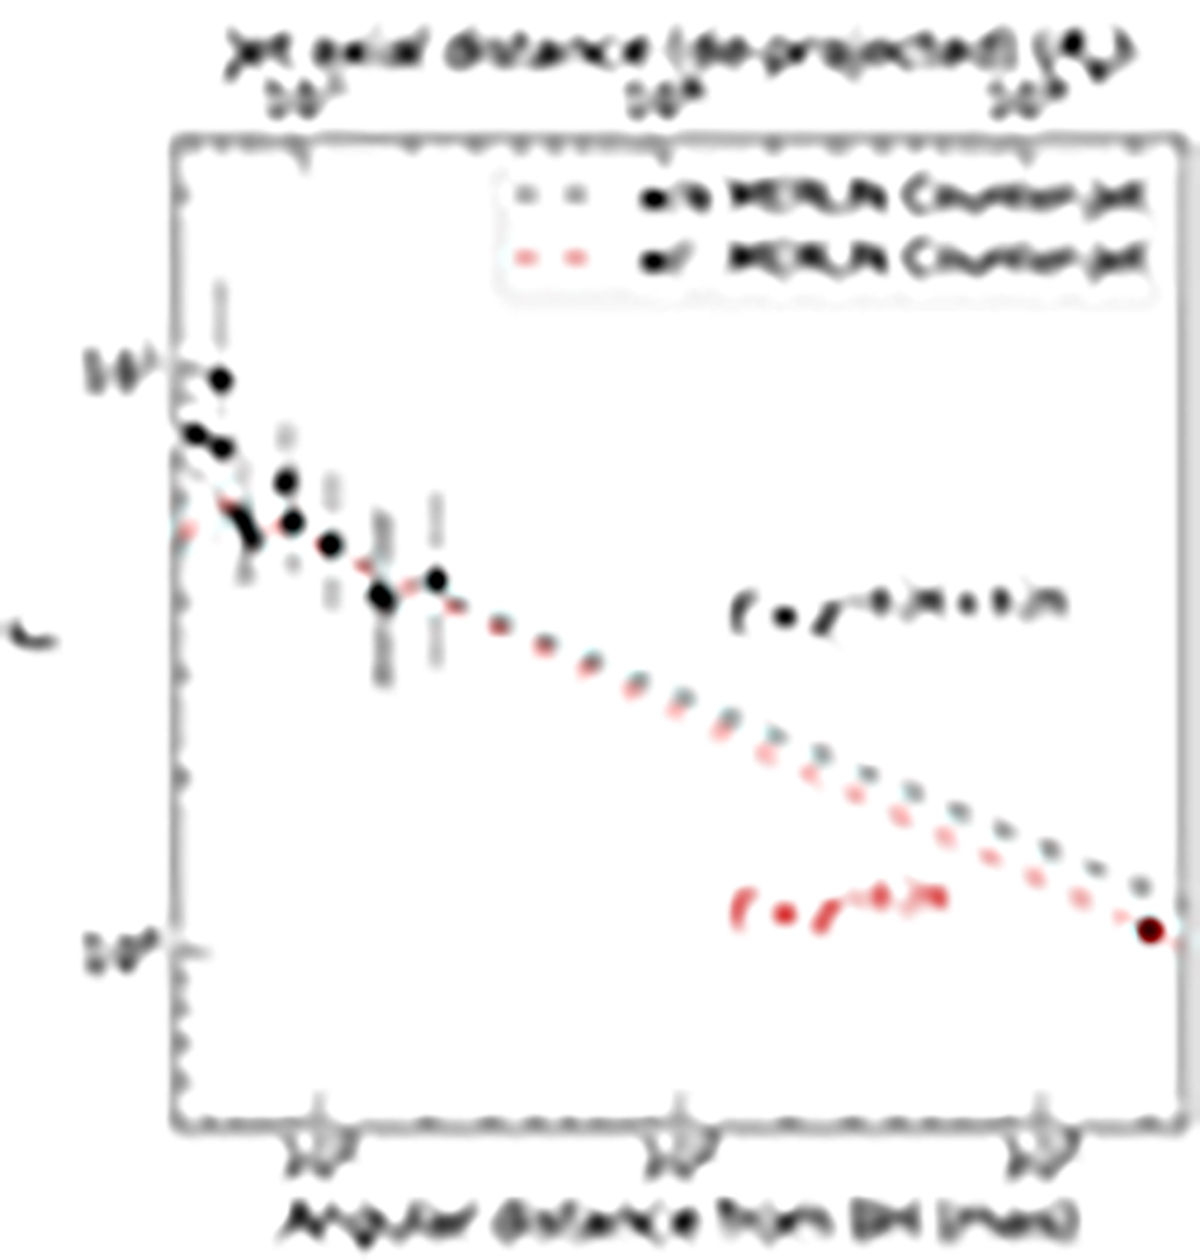
Fig. C.1.
Download original image
Bulk Lorentz factor as a function of distance z from the black hole. The distance is displayed in units of Rg (top axis) and milliarcsecond (bottom axis). The data includes the decelerating part in Figure 5 (gray data points) and the result inferred from the MERLIN observation at 408 MHz (red data point; see text). Error bars represent ±1σ uncertainties. The black dashed line represents the best-fit broken power-law model in Figure 5, and the red one represents the model obtained by including the red data.
Current usage metrics show cumulative count of Article Views (full-text article views including HTML views, PDF and ePub downloads, according to the available data) and Abstracts Views on Vision4Press platform.
Data correspond to usage on the plateform after 2015. The current usage metrics is available 48-96 hours after online publication and is updated daily on week days.
Initial download of the metrics may take a while.