Fig. 3.
Download original image
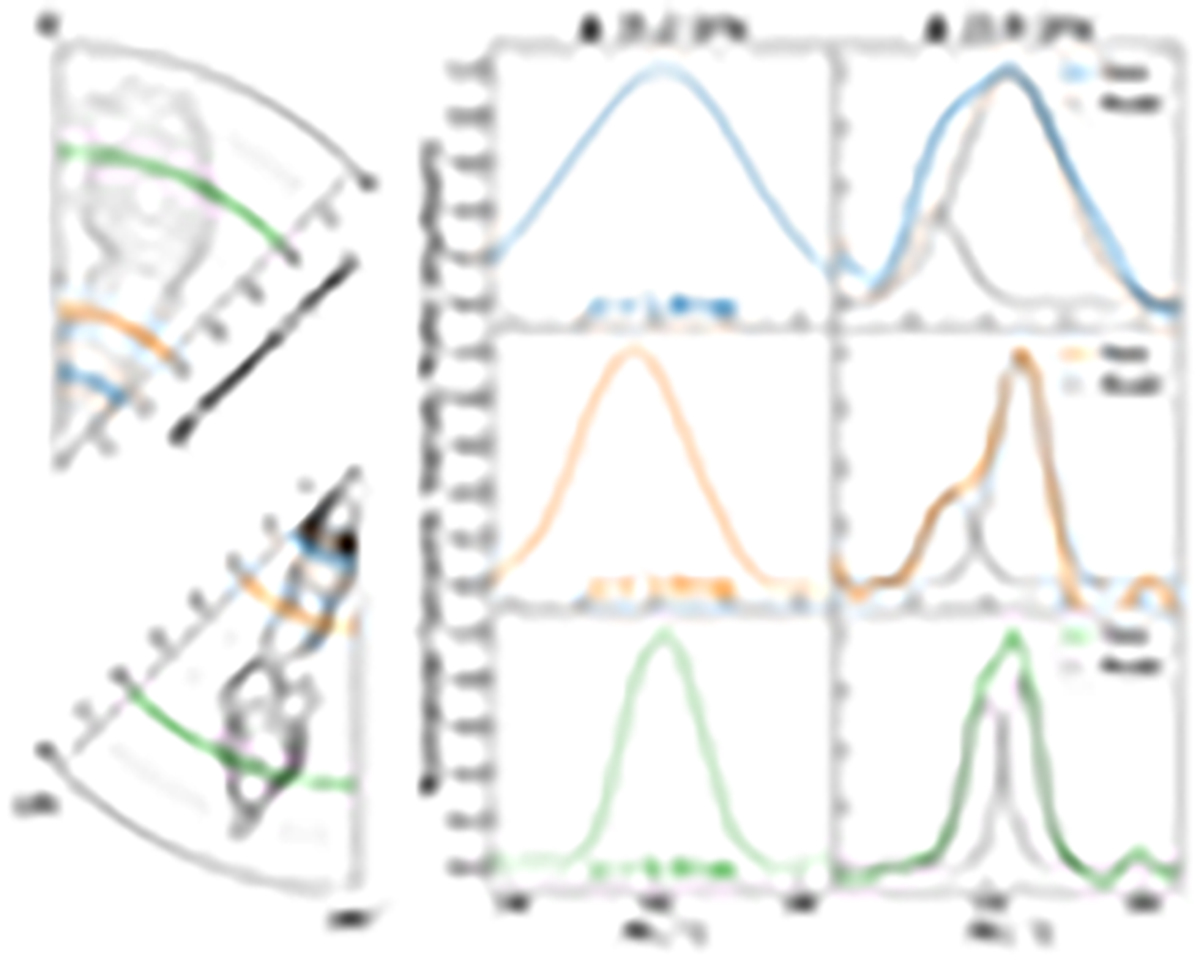
Examples of jet intensity profile along the azimuthal direction. Left: two of our VLBA maps in polar coordinates, convolved with circular beams. The black solid and gray dashed contours represent the 24 GHz and 15 GHz images, respectively. The 15 GHz image has been rotated 180° to ease the presentation. Right: three concentric jet intensity profiles obtained at different angular distances z from the origin of the jet (represented by different colors). The solid and dotted lines denote the intensities at 24 GHz and 15 GHz, respectively. All profiles have been normalized to the unit maximum.
Current usage metrics show cumulative count of Article Views (full-text article views including HTML views, PDF and ePub downloads, according to the available data) and Abstracts Views on Vision4Press platform.
Data correspond to usage on the plateform after 2015. The current usage metrics is available 48-96 hours after online publication and is updated daily on week days.
Initial download of the metrics may take a while.