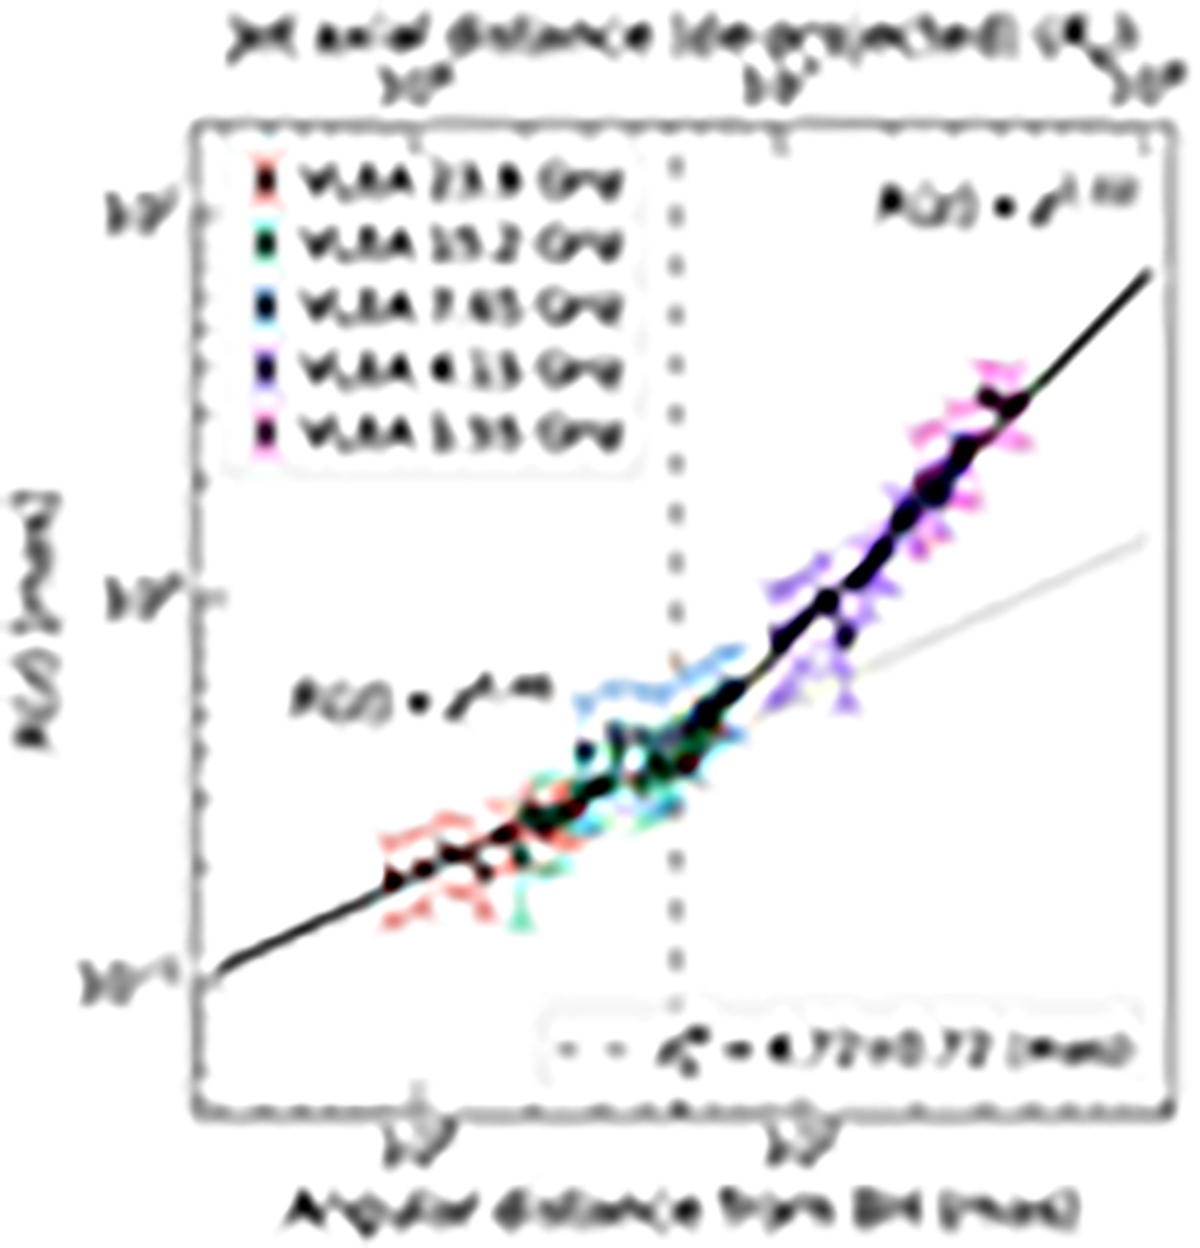
Fig. 4.
Download original image
Jet radius profile as a function of distance z from the black hole. The distance is displayed in units of Rg (top axis) and milliarcsecond (bottom axis). Error bars represent ±1σ uncertainties. The solid line represents the best-fit broken power-law model. The dotted line represents an extrapolation of the inner part of the best-fit model. The vertical dashed line indicates the location of the break in the jet width profile, ![]() .
.
Current usage metrics show cumulative count of Article Views (full-text article views including HTML views, PDF and ePub downloads, according to the available data) and Abstracts Views on Vision4Press platform.
Data correspond to usage on the plateform after 2015. The current usage metrics is available 48-96 hours after online publication and is updated daily on week days.
Initial download of the metrics may take a while.