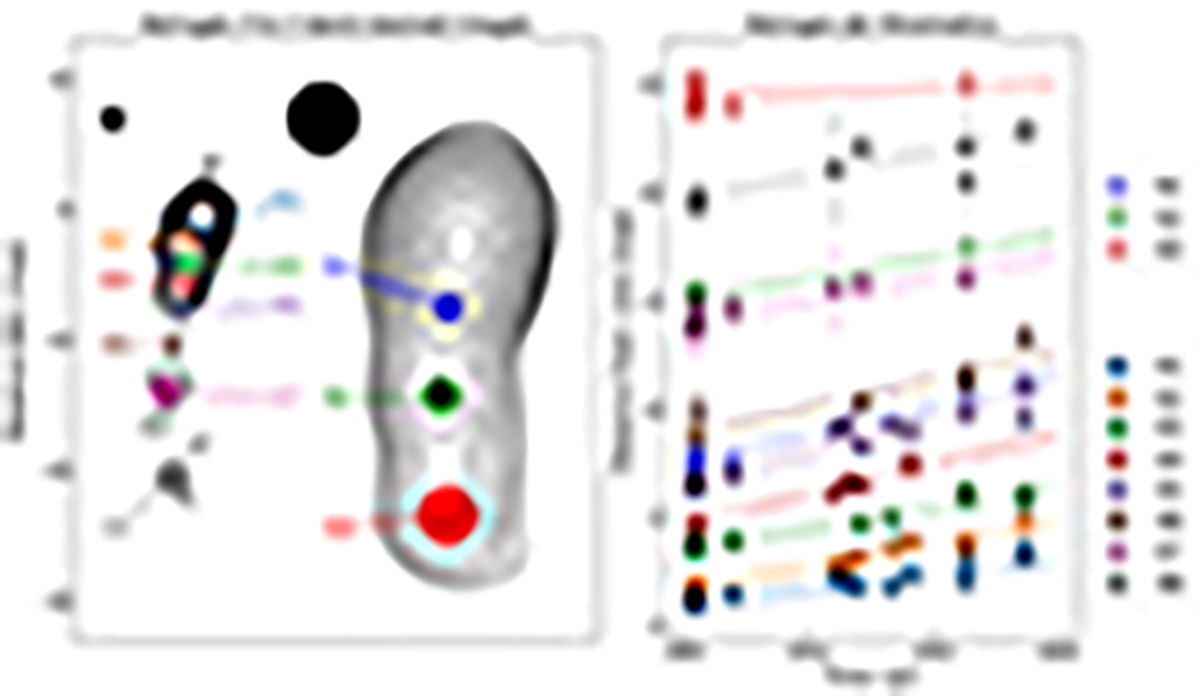
Fig. A.1.
Download original image
Results of the Astrogeo modelfit jet kinematics. Left: Stacked images of naturally weighted CLEAN maps of 1928+738 at X- and S-bands from the Astrogeo program. The averaged circular beams with sizes of 1.57 mas and 5.43 mas, respectively, are shown in the top left of each contour map. The jet components are labeled individually. Right: Distance from the core as a function of time (data points) for all Astrogeo knots detected at ≲8.6 GHz with linear fits (straight lines) overlaid. The different markers are used to distinguish observing frequencies.
Current usage metrics show cumulative count of Article Views (full-text article views including HTML views, PDF and ePub downloads, according to the available data) and Abstracts Views on Vision4Press platform.
Data correspond to usage on the plateform after 2015. The current usage metrics is available 48-96 hours after online publication and is updated daily on week days.
Initial download of the metrics may take a while.