Fig. 11
Download original image
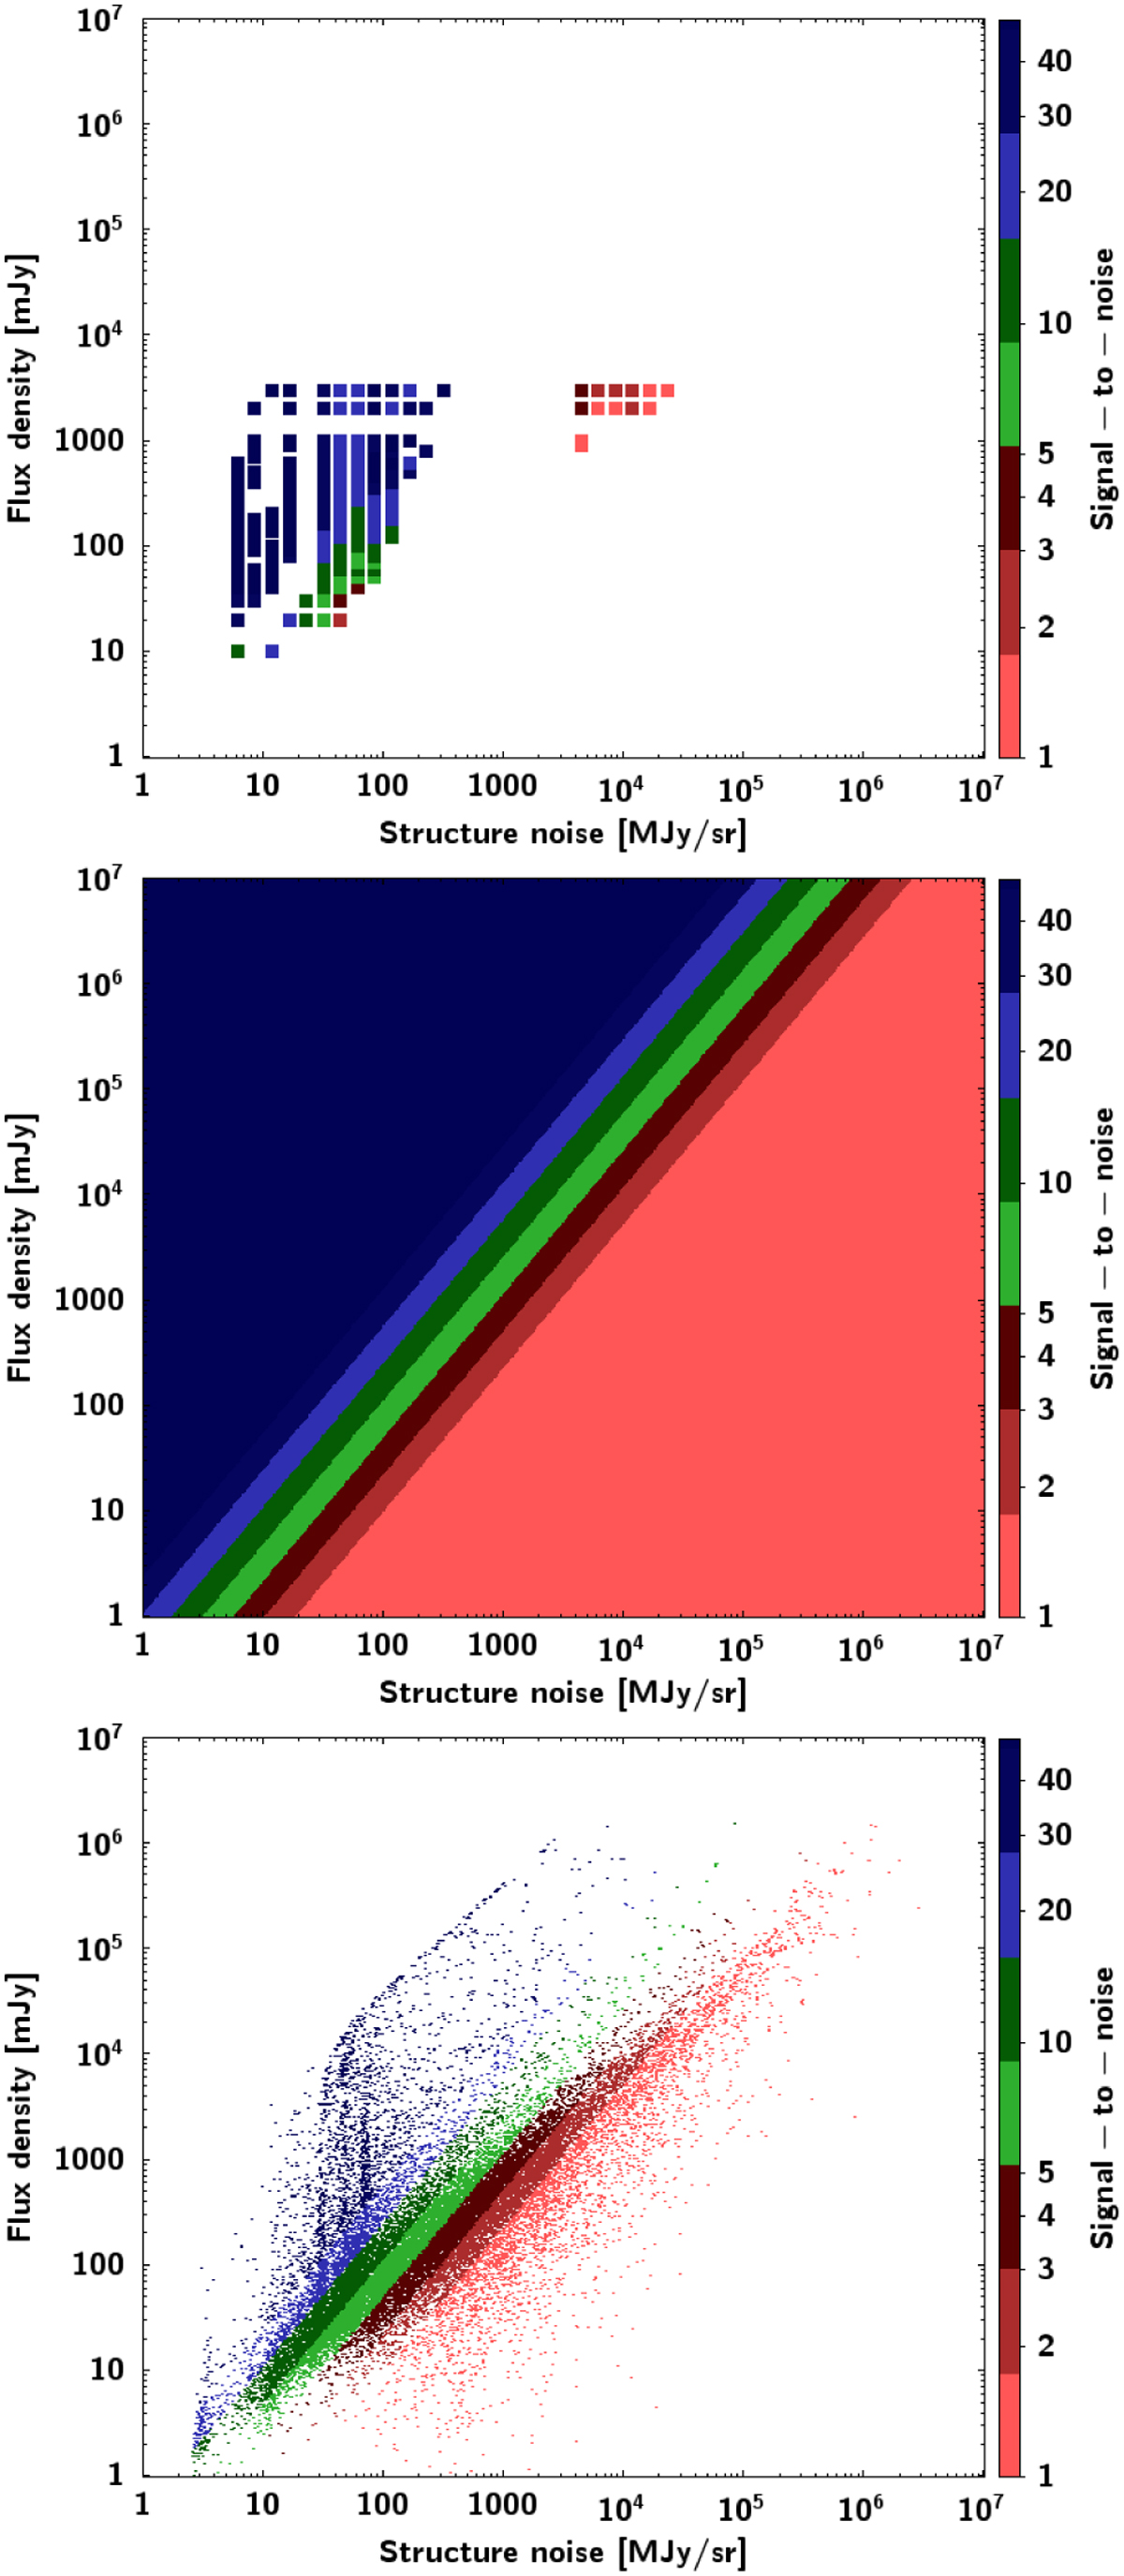
Signal-to-noise ratios in the BS band for the Scan Map mode. Top: signal-to-noise ratio of the simulated sources as a function of NS and the input flux density. Middle: signal-to-noise ratios predicted on a grid by the SVM regression model based on the simulations shown in the top figure. Bottom: signal-to-noise ratios for the real sources predicted by the SVM regression model. In each panel, the signal-to-noise values are shown by the colours on the same logarithmic scale. Figures for all bands and observing modes are shown in Fig. B.2.
Current usage metrics show cumulative count of Article Views (full-text article views including HTML views, PDF and ePub downloads, according to the available data) and Abstracts Views on Vision4Press platform.
Data correspond to usage on the plateform after 2015. The current usage metrics is available 48-96 hours after online publication and is updated daily on week days.
Initial download of the metrics may take a while.