Fig. 1
Download original image
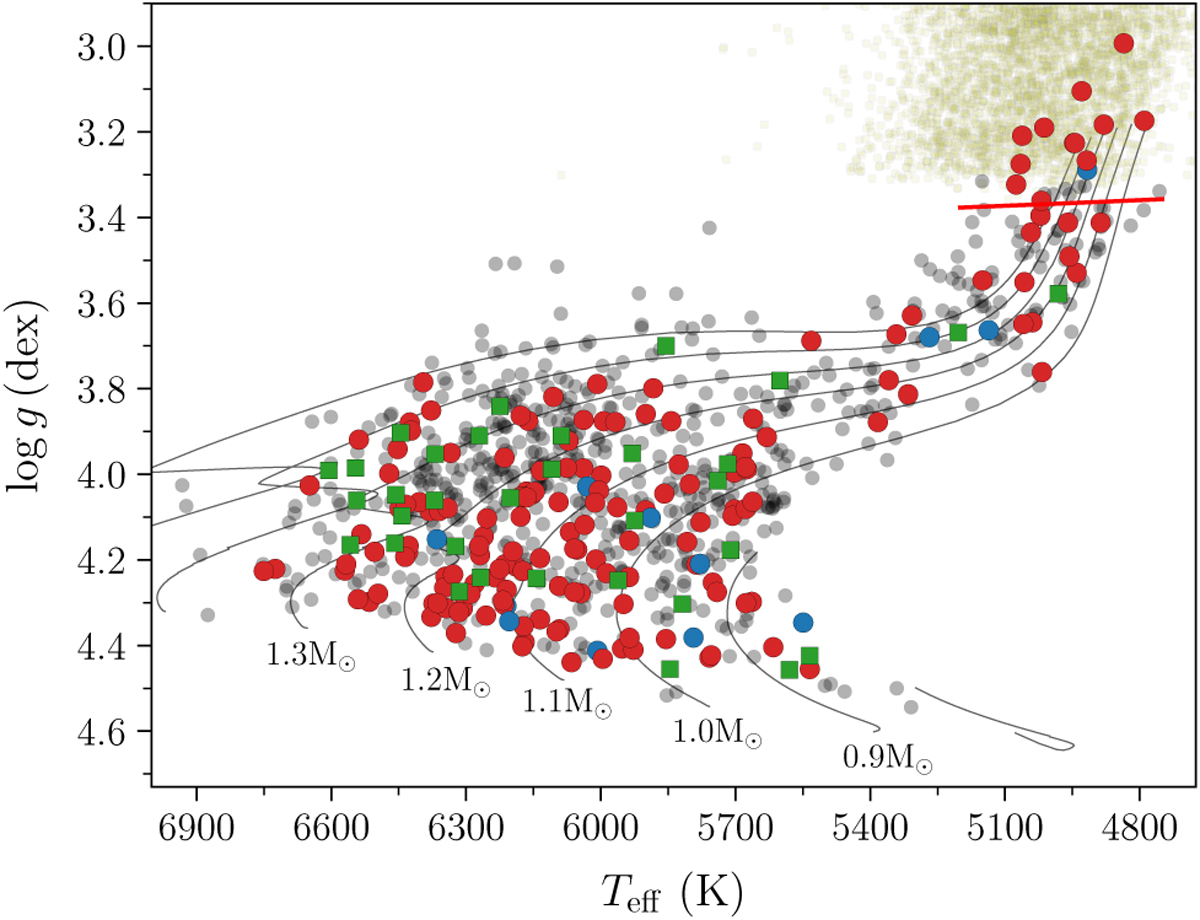
Kiel-diagram of the 173 stars from C6–19 with detected oscillations analysed in this study, in addition to the 33 C1–3 stars of Chaplin et al. (2015) and Lund et al. (2016b). Red circular markers indicate stars with log 𝑔 and Teff values from our spectroscopic analysis (Sect. 4.1.1), while blue circles indicate stars where these were only available from the IRFM (Sect. 4.1.2). The green squares indicate the SPC values for the C1–3 stars (Lund et al. 2016b). The 625 solar-like oscillators from Kepler SC data are shown with smaller gray background markers, using log 𝑔 and Teff from Mathur et al. (2022). The yellow markers to the upper right show the high-log 𝑔 part of the Yu et al. (2018) sample of Kepler giants. The full red line marks a νmax equal to the Kepler LC Nyquist frequency of ~283 µHz. Evolutionary tracks were calculated using GARSTEC (Weiss & Schlattl 2008) with [Fe/H] = 0.
Current usage metrics show cumulative count of Article Views (full-text article views including HTML views, PDF and ePub downloads, according to the available data) and Abstracts Views on Vision4Press platform.
Data correspond to usage on the plateform after 2015. The current usage metrics is available 48-96 hours after online publication and is updated daily on week days.
Initial download of the metrics may take a while.