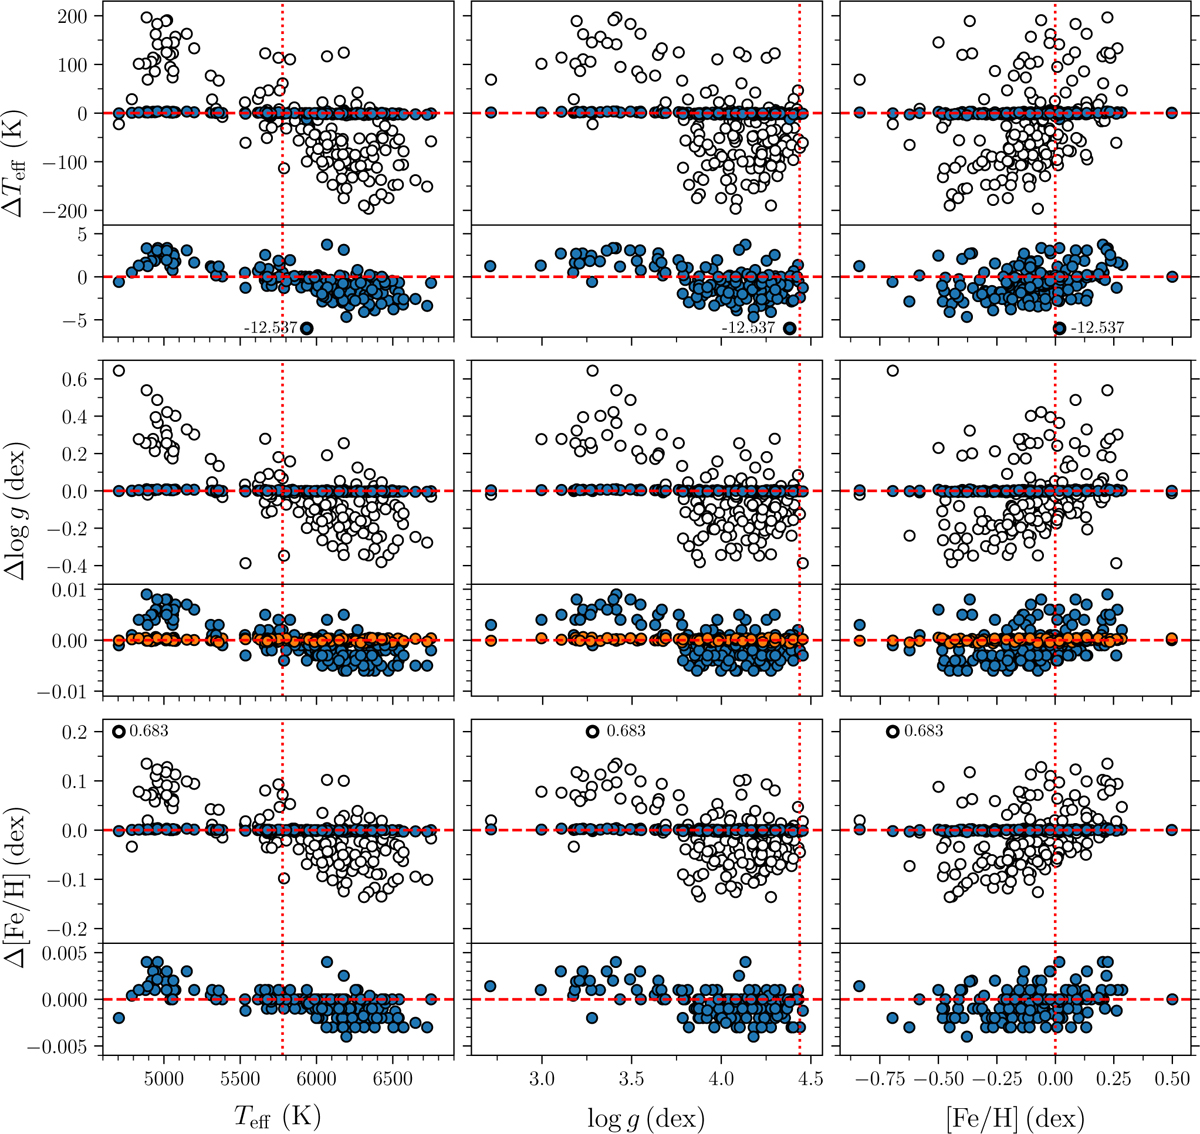
Fig. A.1
Download original image
Change in Teff, log 𝑔, and [Fe/H] from iterating the spectroscopic reduction with a log 𝑔 fixed to the seismic values obtained using νmax and Teff. Changes for a given parameter X are given as ∆X = Xi – Xi+1, with i giving the step in the iteration. In all cases, changes are plotted against the adopted values after the second iteration. White markers indicate values from the first iteration, while blue markers indicate the second iteration. For all nine tiles, combining the changes in the three parameters with their corresponding values, the lower panel provides a zoomed version of the changed from the second iteration. For log 𝑔 the changes from a potential third iteration have been indicated by orange markers. The vertical red dotted lines show, respectively, the solar Teff, log 𝑔, and [Fe/H] values for reference. In all panels, we have added a dashed red horizontal zero-change line. For ∆Teff and ∆[Fe/H] we have moved the ordinate position of two points for a better visualisation – these have been indicated with a bold marker thickness and we have provided the actual value of the point.
Current usage metrics show cumulative count of Article Views (full-text article views including HTML views, PDF and ePub downloads, according to the available data) and Abstracts Views on Vision4Press platform.
Data correspond to usage on the plateform after 2015. The current usage metrics is available 48-96 hours after online publication and is updated daily on week days.
Initial download of the metrics may take a while.