Fig. B.1
Download original image
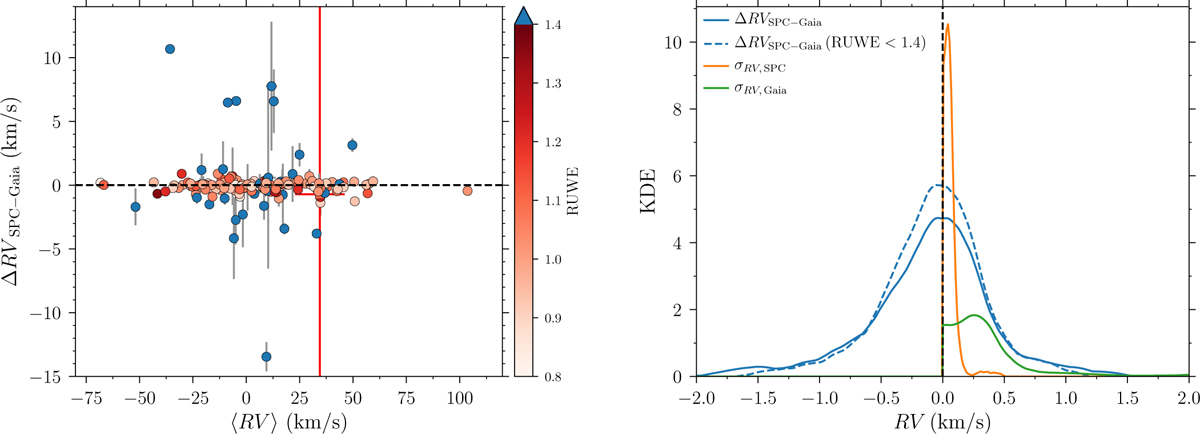
Comparison between radial velocities from Gaia DR2 and those from our SPC analysis. Left: difference in RV against the average, with the colours indicating the RUWE value from Gaia. The target with red errorbars is the one QF = 4 target with a Gaia RV. Right: distributions of the RV differences (both including and excluding targets with high RUWE (> 1.4) values), and RV uncertainties (see legend). For better visualisation we have increased the KDE values on the differences by a factor of 5.
Current usage metrics show cumulative count of Article Views (full-text article views including HTML views, PDF and ePub downloads, according to the available data) and Abstracts Views on Vision4Press platform.
Data correspond to usage on the plateform after 2015. The current usage metrics is available 48-96 hours after online publication and is updated daily on week days.
Initial download of the metrics may take a while.