Fig. D.1
Download original image
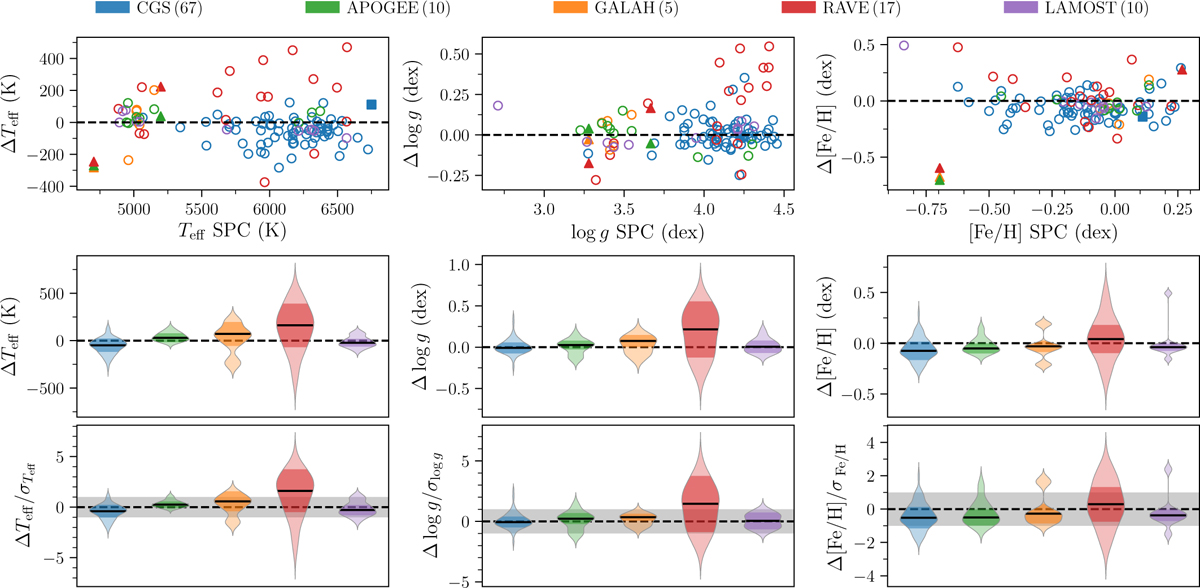
Comparison between our SPC results to those of spectroscopic surveys for Teff (left panels), log 𝑔 (middle panels), and [Fe/H] (right panels). The differences are given as ΔX = XSPC – Xsurvey. The marker color indicates the comparison survey, see the top legend (the numbers in parenthesis indicate to number of stars in common with our SPC sample). Filled triangular (square) markers indicate the SPC QF = 4 (QF = 3) targets. Top row: value difference against SPC value. Middle row: violin plots showing the distributions of the differences, with the medians given by the solid black lines and the darker shaded regions giving the standardized MAD of the differences. Bottom row: Difference distributions, as in the middle row, but normalised by the uncertainty on the differences. The horizontal shaded region provides the ±1σ region.
Current usage metrics show cumulative count of Article Views (full-text article views including HTML views, PDF and ePub downloads, according to the available data) and Abstracts Views on Vision4Press platform.
Data correspond to usage on the plateform after 2015. The current usage metrics is available 48-96 hours after online publication and is updated daily on week days.
Initial download of the metrics may take a while.