Fig. F.1
Download original image
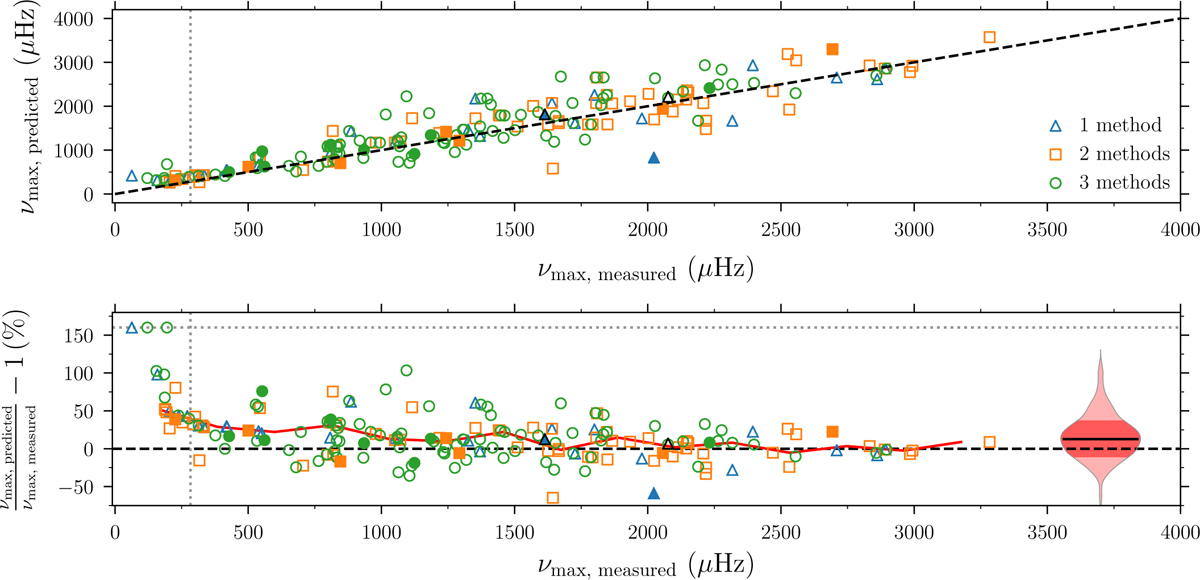
Comparison between measured and predicted values for νmax for stars in C11-19 (empty markers) and and C8+10 (filled markers), with measured values from the CV method. The two targets with black edges indicate the targets where only the SYD method returned detections. Top: a direct comparison, where the dashed line gives the 1:1 relation. The dotted vertical line indicated the Nyquist frequency of ~283 µHz for 30-min long-cadence data (also shown in the bottom panel). Bottom: relative differences between measured and predicted values against the measured values. Targets with a fractional difference above 160% have been moved to this value, as indicated by the dotted horizontal line. The full red line connects ten median-binned values across the νmax range. To the right in this panel, we show a violin plot of the distribution, with the median indicated by the full black line and the spread indicated by the darker shaded interval. The marker type/colour indicates the number of methods for extracting seismic parameters that agree with a positive detection (see legend).
Current usage metrics show cumulative count of Article Views (full-text article views including HTML views, PDF and ePub downloads, according to the available data) and Abstracts Views on Vision4Press platform.
Data correspond to usage on the plateform after 2015. The current usage metrics is available 48-96 hours after online publication and is updated daily on week days.
Initial download of the metrics may take a while.